Brazil – Exports
What is the composition of Brazil exports ?
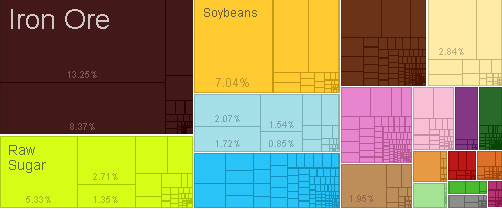
What are the top exports of Brazil ?
| Sr | HS | Description | Value of Exports | Percent of total |
| 1 | 2710 | Refined Petroleum | $16,211,095,935.84 | 7.30% |
| 2 | 2709 | Crude Petroleum | $12,591,901,328.41 | 5.70% |
| 3 | 8703 | Cars | $9,464,743,418.77 | 4.30% |
| 4 | 8708 | Vehicle Parts | $6,835,153,837.29 | 3.10% |
| 5 | 2711 | Petroleum Gas | $6,056,197,470.35 | 2.70% |
| 6 | 8542 | Integrated Circuits | $4,159,006,519.74 | 1.90% |
| 7 | 3004 | Packaged Medicaments | $3,646,320,424.85 | 1.60% |
| 8 | 8517 | Telephones | $3,470,834,852.66 | 1.60% |
| 9 | 8529 | Broadcasting Accessories | $3,369,816,955.81 | 1.50% |
| 10 | 3104 | Potassic Fertilizers | $3,338,594,919.49 | 1.50% |
| 11 | 8704 | Delivery Trucks | $3,070,269,569.98 | 1.40% |
| 12 | 2701 | Coal Briquettes | $2,864,303,853.17 | 1.30% |
| 13 | 8471 | Computers | $2,668,997,135.16 | 1.20% |
| 14 | 3002 | Human or Animal Blood | $2,600,122,423.12 | 1.20% |
| 15 | 8473 | Office Machine Parts | $2,368,065,879.48 | 1.10% |
| 16 | 3808 | Pesticides | $2,274,782,181.79 | 1.00% |
| 17 | 3102 | Nitrogenous Fertilizers | $2,190,771,236.85 | 0.98% |
| 18 | 3105 | Mixed Mineral or Chemical Fertilizers | $2,067,465,077.77 | 0.93% |
| 19 | 7403 | Refined Copper | $2,063,697,862.48 | 0.93% |
| 20 | 8802 | Planes, Helicopters, and/or Spacecraft | $2,021,257,833.11 | 0.91% |
What are the top markets for Brazil ?
| Sr | Code | Country Name | Value of Imports | Percent of total |
| 1 | CHN | China | $33,373,334,208.25 | 15% |
| 2 | USA | United States | $31,701,109,051.23 | 14% |
| 3 | ARG | Argentina | $16,500,479,508.25 | 7.40% |
| 4 | DEU | Germany | $14,773,277,565.79 | 6.60% |
| 5 | KOR | South Korea | $10,268,565,927.09 | 4.60% |
| 6 | NGA | Nigeria | $8,186,785,429.45 | 3.70% |
| 7 | JPN | Japan | $7,534,133,894.91 | 3.40% |
| 8 | ITA | Italy | $6,309,960,213.94 | 2.80% |
| 9 | MEX | Mexico | $5,947,299,712.50 | 2.70% |
| 10 | FRA | France | $5,889,176,121.52 | 2.60% |
| 11 | IND | India | $5,078,407,501.50 | 2.30% |
| 12 | CHL | Chile | $4,219,759,861.87 | 1.90% |
| 13 | GBR | United Kingdom | $3,596,754,333.05 | 1.60% |
| 14 | BOL | Bolivia | $3,592,053,241.83 | 1.60% |
| 15 | ESP | Spain | $3,555,520,583.03 | 1.60% |
| 16 | DZA | Algeria | $3,273,400,159.53 | 1.50% |
| 17 | NLD | Netherlands | $3,140,825,700.34 | 1.40% |
| 18 | Other Asia | $3,082,663,098.31 | 1.40% | |
| 19 | CAN | Canada | $2,823,714,676.46 | 1.30% |
| 20 | CHE | Switzerland | $2,761,574,149.18 | 1.20% |
Statistics sourced from The Observatory of Economic Complexity.
Brazil continues to strengthen its local production capabilities, and diversify its export markets.
Are you looking to source products from Zimbabwe ? Need guidance and linkages to export sources. Click here to send your questions.
![]()