Canada – Exports
What is the composition of Canada exports ?
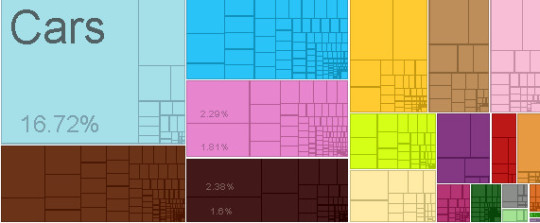
What are the top exports of Canada ?
| Sr | HS | Description | Value of Exports | Percent of total |
| 1 | 8703 | Cars | $47,632,275,183.73 | 17% |
| 2 | 8802 | Planes, Helicopters, and/or Spacecraft | $7,322,189,599.08 | 2.60% |
| 3 | 2701 | Coal Briquettes | $6,766,734,993.45 | 2.40% |
| 4 | 3104 | Potassic Fertilizers | $6,519,906,299.20 | 2.30% |
| 5 | 1001 | Wheat | $6,317,661,362.08 | 2.20% |
| 6 | 7601 | Raw Aluminium | $5,570,989,188.46 | 2.00% |
| 7 | 1205 | Rapeseed | $5,190,981,929.16 | 1.80% |
| 8 | 3004 | Packaged Medicaments | $5,162,262,035.54 | 1.80% |
| 9 | 2601 | Iron Ore | $4,569,647,193.57 | 1.60% |
| 10 | 4703 | Sulfate Chemical Woodpulp | $4,390,976,471.11 | 1.50% |
| 11 | 3901 | Ethylene Polymers | $4,022,054,689.28 | 1.40% |
| 12 | 7108 | Gold | $3,730,861,085.93 | 1.30% |
| 13 | 1514 | Rapeseed Oil | $3,398,593,051.01 | 1.20% |
| 14 | 8411 | Gas Turbines | $3,231,886,350.02 | 1.10% |
| 15 | 2603 | Copper Ore | $3,107,533,150.16 | 1.10% |
| 16 | 203 | Pig Meat | $2,828,447,043.50 | 0.99% |
| 17 | 8803 | Aircraft Parts | $2,758,516,000.64 | 0.97% |
| 18 | 8407 | Spark-Ignition Engines | $2,740,172,896.06 | 0.96% |
| 19 | 7501 | Nickel Mattes | $2,563,312,388.97 | 0.90% |
| 20 | 2710 | Refined Petroleum | $2,514,531,074.56 | 0.88% |
What are the top markets for Canada ?
| Sr | Code | Country Name | Value of Imports | Percent of total | |
| 1 | USA | United States | $176,854,116,170.08 | 62% | |
| 2 | CHN | China | $19,820,428,376.88 | 7.00% | |
| 3 | JPN | Japan | $10,117,497,001.05 | 3.60% | |
| 4 | GBR | United Kingdom | $7,624,672,344.84 | 2.70% | |
| 5 | MEX | Mexico | $7,088,002,729.14 | 2.50% | |
| 6 | DEU | Germany | $4,497,175,885.65 | 1.60% | |
| 7 | KOR | South Korea | $4,454,101,103.88 | 1.60% | |
| 8 | NLD | Netherlands | $3,723,971,141.54 | 1.30% | |
| 9 | FRA | France | $3,705,800,001.38 | 1.30% | |
| 10 | BRA | Brazil | $2,823,714,676.46 | 0.99% | |
| 11 | NOR | Norway | $2,692,534,948.93 | 0.95% | |
| 12 | IND | India | $2,561,525,087.39 | 0.90% | |
| 13 | AUS | Australia | $2,395,910,080.28 | 0.84% | |
| 14 | HKG | Hong Kong | $2,238,792,677.05 | 0.79% | |
| 15 | ITA | Italy | $2,129,058,450.99 | 0.75% | |
| 16 | BLX | Belgium-Luxembourg | $1,839,080,045.75 | 0.65% | |
| 17 | RUS | Russia | $1,823,760,279.17 | 0.64% | |
| 18 | IDN | Indonesia | $1,721,320,655.74 | 0.60% | |
| 19 | ESP | Spain | $1,356,889,335.35 | 0.48% | |
| 20 |
|
Other Asia | $1,118,075,423.00 | 0.39% |
Statistics sourced from The Observatory of Economic Complexity.
Canada continues to strengthen its local production capabilities, and diversify its export markets.
Are you looking to source products fromCanada ? Need guidance and linkages to export sources. Click here to send your questions.
![]()