Qatar – Exports
What is the composition of Qatar exports ?
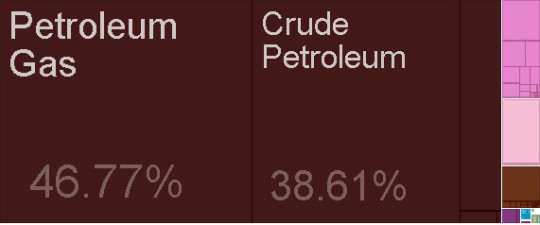
What are the top exports of Qatar ?
| Sr | HS | Description | Value of Exports | Percent of total |
| 1 | 2711 | Petroleum Gas | $47,445,100,988.99 | 47% |
| 2 | 2709 | Crude Petroleum | $39,170,679,530.21 | 39% |
| 3 | 2710 | Refined Petroleum | $7,154,345,925.86 | 7.10% |
| 4 | 3901 | Ethylene Polymers | $2,176,607,494.32 | 2.10% |
| 5 | 3102 | Nitrogenous Fertilizers | $1,327,721,855.50 | 1.30% |
| 6 | 7601 | Raw Aluminium | $1,174,423,520.31 | 1.20% |
| 7 | 2901 | Acyclic Hydrocarbons | $535,712,592.99 | 0.53% |
| 8 | 2503 | Sulphur | $364,779,892.04 | 0.36% |
| 9 | 2814 | Ammonia | $334,156,528.55 | 0.33% |
| 10 | 2909 | Ethers | $249,134,378.09 | 0.25% |
| 11 | 2903 | Halogenated Hydrocarbons | $218,829,898.77 | 0.22% |
| 12 | 7113 | Jewellery | $198,683,679.00 | 0.20% |
| 13 | 3817 | Alkylbenzenes and Alkylnaphthalenes | $167,661,642.95 | 0.17% |
| 14 | 2905 | Acyclic Alcohols | $151,789,422.54 | 0.15% |
| 15 | 2933 | Nitrogen Heterocyclic Compounds | $66,934,346.78 | 0.07% |
| 16 | 2804 | Hydrogen | $57,462,465.66 | 0.06% |
| 17 | 2815 | Sodium or Potassium Peroxides | $52,297,158.09 | 0.05% |
| 18 | 7203 | Iron Reductions | $41,527,116.89 | 0.04% |
| 19 | 2707 | Coal Tar Oil | $41,042,449.15 | 0.04% |
| 20 | 7102 | Diamonds | $38,596,923.00 | 0.04% |
What are the top markets for Qatar ?
| Sr | Code | Country Name | Value of Exports | Percent of total |
| 1 | JPN | Japan | $31,513,847,498.86 | 31% |
| 2 | KOR | South Korea | $22,502,503,497.57 | 22% |
| 3 | IND | India | $14,740,416,607.01 | 15% |
| 4 | SGP | Singapore | $6,710,324,252.31 | 6.60% |
| 5 | CHN | China | $6,496,931,530.30 | 6.40% |
| 6 | GBR | United Kingdom | $3,949,260,947.79 | 3.90% |
| 7 | ITA | Italy | $2,732,344,563.93 | 2.70% |
| 8 | ESP | Spain | $1,612,584,195.85 | 1.60% |
| 9 | IDN | Indonesia | $1,445,756,775.32 | 1.40% |
| 10 | MYS | Malaysia | $1,172,287,813.54 | 1.20% |
| 11 | THA | Thailand | $1,063,258,027.46 | 1.00% |
| 12 | BRA | Brazil | $656,052,052.58 | 0.65% |
| 13 | PHL | Philippines | $590,372,694.92 | 0.58% |
| 14 | AUS | Australia | $514,855,678.32 | 0.51% |
| 15 | USA | United States | $478,330,190.56 | 0.47% |
| 16 | ZAF | South Africa | $458,022,520.00 | 0.45% |
| 17 | TUR | Turkey | $449,176,236.26 | 0.44% |
| 18 | ARG | Argentina | $392,895,653.11 | 0.39% |
| 19 | NLD | Netherlands | $376,449,106.92 | 0.37% |
| 20 | NZL | New Zealand | $363,228,220.69 | 0.36% |
Statistics sourced from The Observatory of Economic Complexity.
Qatar continues to strengthen its local production capabilities, and diversify its export markets.
Are you looking to source products from Qatar ? Need guidance and linkages to export sources. Click here to send your questions.
![]()