South Africa – Exports
What is the composition of South Africa exports ?
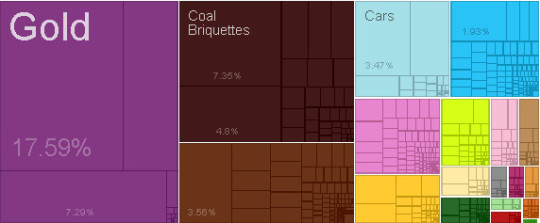
What are the top exports of South Africa ?
| Sr | HS | Description | Value of Exports | Percent of total |
| 1 | 7108 | Gold | $20,436,346,550.00 | 18% |
| 2 | 7110 | Platinum | $9,013,619,304.23 | 7.80% |
| 3 | 2701 | Coal Briquettes | $8,537,432,040.19 | 7.40% |
| 4 | 7102 | Diamonds | $8,465,991,912.37 | 7.30% |
| 5 | 2601 | Iron Ore | $5,580,878,669.99 | 4.80% |
| 6 | 7202 | Ferroalloys | $4,135,353,767.77 | 3.60% |
| 7 | 8703 | Cars | $4,027,162,268.02 | 3.50% |
| 8 | 8704 | Delivery Trucks | $2,949,354,315.93 | 2.50% |
| 9 | 8421 | Centrifuges | $2,246,321,105.49 | 1.90% |
| 10 | 2710 | Refined Petroleum | $1,560,497,471.13 | 1.30% |
| 11 | 2602 | Manganese Ore | $1,264,825,105.18 | 1.10% |
| 12 | 2610 | Chromium Ore | $1,259,308,371.56 | 1.10% |
| 13 | 805 | Citrus | $1,188,474,021.74 | 1.00% |
| 14 | 7601 | Raw Aluminium | $1,053,449,541.64 | 0.91% |
| 15 | 8708 | Vehicle Parts | $935,870,534.10 | 0.81% |
| 16 | 2204 | Wine | $827,776,778.43 | 0.71% |
| 17 | 7219 | Large Flat-Rolled Stainless Steel | $774,655,695.34 | 0.67% |
| 18 | 806 | Grapes | $764,053,426.10 | 0.66% |
| 19 | 2614 | Titanium Ore | $734,710,461.61 | 0.63% |
| 20 | 2603 | Copper Ore | $732,958,423.04 | 0.63% |
What are the top markets for South Africa ?
| Sr | Code | Country Name | Value of Exports | Percent of total |
| 1 | CHN | China | $9,681,922,640.48 | 8.30% |
| 2 | USA | United States | $9,356,959,614.50 | 8.10% |
| 3 | IND | India | $9,089,122,323.84 | 7.80% |
| 4 | GBR | United Kingdom | $8,341,071,962.82 | 7.20% |
| 5 | XXA | Areas | $7,804,680,647.00 | 6.70% |
| 6 | JPN | Japan | $6,326,740,956.35 | 5.40% |
| 7 | HKG | Hong Kong | $5,841,133,577.82 | 5.00% |
| 8 | DEU | Germany | $5,692,764,744.57 | 4.90% |
| 9 | BLX | Belgium-Luxembourg | $3,630,142,844.24 | 3.10% |
| 10 | ZWE | Zimbabwe | $2,995,526,815.95 | 2.60% |
| 11 | ZMB | Zambia | $2,758,644,272.00 | 2.40% |
| 12 | NLD | Netherlands | $2,634,200,880.43 | 2.30% |
| 13 | ITA | Italy | $2,519,609,693.25 | 2.20% |
| 14 | CHE | Switzerland | $2,460,127,246.47 | 2.10% |
| 15 | KOR | South Korea | $2,112,960,338.76 | 1.80% |
| 16 | THA | Thailand | $1,895,712,992.12 | 1.60% |
| 17 | MOZ | Mozambique | $1,672,022,016.11 | 1.40% |
| 18 | AGO | Angola | $1,647,152,855.00 | 1.40% |
| 19 | COD | Democratic Republic of the Congo | $1,566,132,165.00 | 1.30% |
| 20 | MYS | Malaysia | $1,444,527,022.05 | 1.20% |
Statistics sourced from The Observatory of Economic Complexity.
South Africa continues to strengthen its local production capabilities, and diversify its export markets.
Are you looking to source products from South Africa ? Need guidance and linkages to export sources. Click here to send your questions.
![]()