USA – Exports
What is the composition of USA exports ?
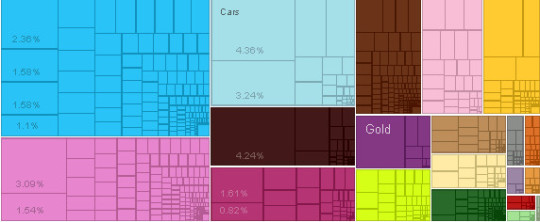
What are the top exports of USA ?
| Sr | HS | Description | Value of Exports | Percent of total |
| 1 | 8703 | Cars | $53,390,515,139.42 | 4.40% |
| 2 | 2710 | Refined Petroleum | $51,929,851,138.19 | 4.20% |
| 3 | 8802 | Planes, Helicopters, and/or Spacecraft | $39,630,464,571.59 | 3.20% |
| 4 | 3004 | Packaged Medicaments | $37,876,804,582.60 | 3.10% |
| 5 | 8411 | Gas Turbines | $28,953,128,241.88 | 2.40% |
| 6 | 7108 | Gold | $27,154,344,294.47 | 2.20% |
| 7 | 1201 | Soybeans | $23,665,409,053.38 | 1.90% |
| 8 | 9018 | Medical Instruments | $19,784,359,837.15 | 1.60% |
| 9 | 8542 | Integrated Circuits | $19,353,229,534.12 | 1.60% |
| 10 | 8471 | Computers | $19,310,394,304.61 | 1.60% |
| 11 | 8704 | Delivery Trucks | $18,872,850,983.77 | 1.50% |
| 12 | 3002 | Human or Animal Blood | $18,865,213,170.14 | 1.50% |
| 13 | 8803 | Aircraft Parts | $17,013,034,243.81 | 1.40% |
| 14 | 2701 | Coal Briquettes | $16,227,453,395.72 | 1.30% |
| 15 | 8517 | Telephones | $13,479,288,305.17 | 1.10% |
| 16 | 8481 | Valves | $10,677,186,251.52 | 0.87% |
| 17 | 1005 | Corn | $10,236,319,751.48 | 0.84% |
| 18 | 9021 | Orthopedic Appliances | $10,100,763,136.68 | 0.82% |
| 19 | 7204 | Scrap Iron | $9,036,187,113.76 | 0.74% |
| 20 | 8429 | Large Construction Vehicles | $8,507,204,093.52 | 0.69% |
What are the top markets for USA ?
| Sr | Code | Country Name | Value of Exports | Percent of total |
| 1 | CAN | Canada | $159,010,407,131.04 | 13% |
| 2 | MEX | Mexico | $137,814,098,650.80 | 11% |
| 3 | CHN | China | $113,513,408,959.25 | 9.30% |
| 4 | JPN | Japan | $67,053,083,641.72 | 5.50% |
| 5 | DEU | Germany | $59,915,587,446.37 | 4.90% |
| 6 | GBR | United Kingdom | $42,747,956,386.39 | 3.50% |
| 7 | KOR | South Korea | $41,477,219,354.67 | 3.40% |
| 8 | FRA | France | $38,516,345,967.99 | 3.10% |
| 9 | NLD | Netherlands | $33,226,722,792.15 | 2.70% |
| 10 | BRA | Brazil | $31,701,109,051.23 | 2.60% |
| 11 | AUS | Australia | $29,088,900,096.69 | 2.40% |
| 12 | BLX | Belgium-Luxembourg | $28,176,701,543.13 | 2.30% |
| 13 | HKG | Hong Kong | $27,089,083,138.85 | 2.20% |
| 14 | CHE | Switzerland | $24,377,443,161.98 | 2.00% |
| 15 | SGP | Singapore | $21,754,320,521.56 | 1.80% |
| 16 | IND | India | $18,953,648,083.39 | 1.50% |
| 17 | CHL | Chile | $17,368,102,248.66 | 1.40% |
| 18 | ITA | Italy | $15,676,868,156.13 | 1.30% |
| 19 | Other Asia | $14,893,463,859.00 | 1.20% | |
| 20 | COL | Colombia | $13,711,792,269.29 | 1.10% |
Statistics sourced from The Observatory of Economic Complexity.
USA continues to strengthen its local production capabilities, and diversify its export markets.
Are you looking to source products from USA ? Need guidance and linkages to export sources. Click here to send your questions.
![]()