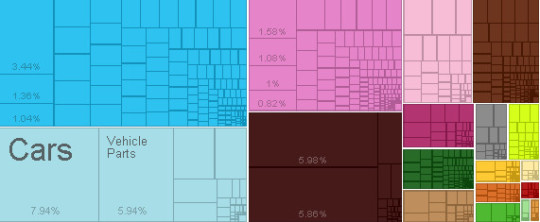
Argentina – Exports
What is the composition of Argentina exports ?
What are the top exports of Argentina ?
| Sr | HS | Description | Value of Exports | Percent of total |
| 1 | 8703 | Cars | $5,325,790,093.35 | 7.90% |
| 2 | 2711 | Petroleum Gas | $4,010,882,961.66 | 6.00% |
| 3 | 8708 | Vehicle Parts | $3,984,423,848.01 | 5.90% |
| 4 | 2710 | Refined Petroleum | $3,932,385,444.87 | 5.90% |
| 5 | 8517 | Telephones | $2,307,764,002.28 | 3.40% |
| 6 | 8704 | Delivery Trucks | $1,186,308,890.89 | 1.80% |
| 7 | 3004 | Packaged Medicaments | $1,056,494,538.95 | 1.60% |
| 8 | 8802 | Planes, Helicopters, and/or Spacecraft | $924,686,100.93 | 1.40% |
| 9 | 8471 | Computers | $915,178,820.72 | 1.40% |
| 10 | 3002 | Human or Animal Blood | $726,765,036.29 | 1.10% |
| 11 | 8529 | Broadcasting Accessories | $696,146,920.42 | 1.00% |
| 12 | 2601 | Iron Ore | $679,296,699.17 | 1.00% |
| 13 | 3808 | Pesticides | $667,550,835.29 | 1.00% |
| 14 | 3901 | Ethylene Polymers | $592,198,642.94 | 0.88% |
| 15 | 8409 | Engine Parts | $577,638,021.95 | 0.86% |
| 16 | 8701 | Tractors | $576,762,424.25 | 0.86% |
| 17 | 8407 | Spark-Ignition Engines | $564,467,603.50 | 0.84% |
| 18 | 8414 | Air Pumps | $563,717,374.68 | 0.84% |
| 19 | 3105 | Mixed Mineral or Chemical Fertilizers | $551,358,015.88 | 0.82% |
| 20 | 2931 | Other Organo-Inorganic Compounds | $503,303,763.59 | 0.75% |
What are the top markets for Argentina ?
| Sr | Code | Country Name | Value of Imports | Percent of total |
| 1 | BRA | Brazil | $17,791,343,136.86 | 27% |
| 2 | CHN | China | $9,907,155,061.92 | 15% |
| 3 | USA | United States | $8,473,672,317.73 | 13% |
| 4 | DEU | Germany | $3,615,514,542.97 | 5.40% |
| 5 | MEX | Mexico | $2,213,222,480.13 | 3.30% |
| 6 | TTO | Trinidad and Tobago | $1,706,037,458.45 | 2.50% |
| 7 | BOL | Bolivia | $1,685,895,027.06 | 2.50% |
| 8 | FRA | France | $1,628,945,606.41 | 2.40% |
| 9 | ITA | Italy | $1,478,606,768.17 | 2.20% |
| 10 | JPN | Japan | $1,472,175,184.08 | 2.20% |
| 11 | ESP | Spain | $1,333,313,876.96 | 2.00% |
| 12 | KOR | South Korea | $1,127,931,036.37 | 1.70% |
| 13 | NLD | Netherlands | $1,077,043,135.22 | 1.60% |
| 14 | CHL | Chile | $1,023,998,016.16 | 1.50% |
| 15 | RUS | Russia | $897,118,594.72 | 1.30% |
| 16 | THA | Thailand | $877,190,117.21 | 1.30% |
| 17 | IND | India | $665,142,072.50 | 0.99% |
| 18 | GBR | United Kingdom | $617,870,012.18 | 0.92% |
| 19 | CHE | Switzerland | $560,352,410.25 | 0.84% |
| 20 | URY | Uruguay | $515,730,099.10 | 0.77% |
Statistics sourced from The Observatory of Economic Complexity.
Argentina continues to strengthen its local production capabilities, and diversify its export markets.
Are you looking to source products from Argentina ? Need guidance and linkages to export sources. Click here to send your questions.


