


Tanzania – Imports
 Imports of Tanzania
What is the composition of Tanzania’s imports?
What are the top imports of Tanzania ?
| Sr | HS | Description | Value of Exports | Percent of total |
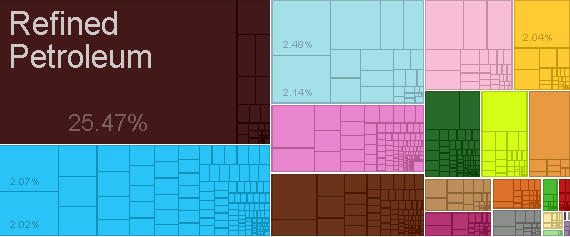
| 1 | 2710 | Refined Petroleum | $2,942,790,342.01 | 25% |
| 2 | 8703 | Cars | $286,799,063.52 | 2.50% |
| 3 | 8704 | Delivery Trucks | $247,429,835.90 | 2.10% |
| 4 | 1511 | Palm Oil | $241,251,929.55 | 2.10% |
| 5 | 8517 | Telephones | $239,156,323.51 | 2.10% |
| 6 | 1001 | Wheat | $235,747,256.86 | 2.00% |
| 7 | 8431 | Excavation Machinery | $233,914,320.68 | 2.00% |
| 8 | 8701 | Tractors | $214,757,454.02 | 1.90% |
| 9 | 7208 | Hot-Rolled Iron | $184,719,034.55 | 1.60% |
| 10 | 4011 | Rubber Tires | $167,830,778.20 | 1.50% |
| 11 | 1701 | Raw Sugar | $167,570,068.63 | 1.50% |
| 12 | 3004 | Packaged Medicaments | $162,078,092.94 | 1.40% |
| 13 | 5208 | Light Pure Woven Cotton | $117,629,903.99 | 1.00% |
| 14 | 3902 | Propylene Polymers | $106,337,662.62 | 0.92% |
| 15 | 8429 | Large Construction Vehicles | $105,603,973.15 | 0.91% |
| 16 | 8471 | Computers | $105,204,251.54 | 0.91% |
| 17 | 3901 | Ethylene Polymers | $104,613,166.83 | 0.91% |
| 18 | 8502 | Electric Generating Sets | $99,542,813.25 | 0.86% |
| 19 | 8716 | Trailers | $94,912,982.32 | 0.82% |
| 20 | 2711 | Petroleum Gas | $94,334,856.26 | 0.82% |
Who are the top countries of origin for Tanzania ?
| Sr | Code | Country Name | Value of Imports | Percent of total |
| 1 | CHN | China | $1,386,548,713.88 | 12% |
| 2 | CHE | Switzerland | $1,019,364,342.48 | 8.80% |
| 3 | ZAF | South Africa | $997,680,257.10 | 8.60% |
| 4 | ARE | United Arab Emirates | $968,427,985.54 | 8.40% |
| 5 | IND | India | $880,118,110.94 | 7.60% |
| 6 | BHR | Bahrain | $841,654,848.05 | 7.30% |
| 7 | KEN | Kenya | $550,107,447.79 | 4.80% |
| 8 | JPN | Japan | $501,729,553.76 | 4.30% |
| 9 | GBR | United Kingdom | $356,895,459.27 | 3.10% |
| 10 | IDN | Indonesia | $239,227,228.38 | 2.10% |
| 11 | USA | United States | $238,881,034.02 | 2.10% |
| 12 | BLX | Belgium-Luxembourg | $221,985,136.37 | 1.90% |
| 13 | SAU | Saudi Arabia | $215,395,039.46 | 1.90% |
| 14 | DEU | Germany | $213,344,310.84 | 1.80% |
| 15 | SWE | Sweden | $173,820,021.17 | 1.50% |
| 16 | NLD | Netherlands | $167,341,869.98 | 1.40% |
| 17 | RWA | Rwanda | $165,527,656.85 | 1.40% |
| 18 | OMN | Oman | $147,695,842.76 | 1.30% |
| 19 | SGP | Singapore | $142,344,163.77 | 1.20% |
| 20 | TUR | Turkey | $139,493,634.02 | 1.20% |
Statistics sourced from The Observatory of Economic Complexity.
Tanzania continues to strengthen its local production capabilities, and diversify its export markets.
Are you looking to source products from Tanzania ? Need guidance and linkages to export sources. Click here to send your questions.
![]()