


Mexico – Imports
 Imports of Mexico
What is the composition of Mexico’s imports?
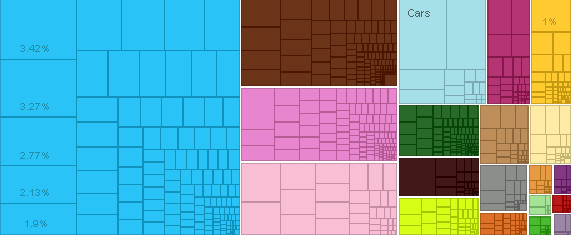
What are the top imports of Mexico ?
| Sr | HS | Description | Value of Exports | Percent of total |
| 1 | 8529 | Broadcasting Accessories | $10,089,837,131.08 | 3.40% |
| 2 | 8471 | Computers | $9,649,512,207.18 | 3.30% |
| 3 | 8517 | Telephones | $8,187,853,933.05 | 2.80% |
| 4 | 8703 | Cars | $7,614,778,450.55 | 2.60% |
| 5 | 8473 | Office Machine Parts | $6,291,007,847.19 | 2.10% |
| 6 | 8708 | Vehicle Parts | $6,163,091,965.81 | 2.10% |
| 7 | 8525 | Broadcasting Equipment | $5,598,224,577.76 | 1.90% |
| 8 | 8542 | Integrated Circuits | $5,126,608,468.60 | 1.70% |
| 9 | 8536 | Low-voltage Protection Equipment | $4,819,029,588.97 | 1.60% |
| 10 | 8544 | Insulated Wire | $4,593,209,140.99 | 1.60% |
| 11 | 8408 | Combustion Engines | $4,061,614,089.69 | 1.40% |
| 12 | 3926 | Other Plastic Products | $3,481,017,602.61 | 1.20% |
| 13 | 8409 | Engine Parts | $3,222,864,382.18 | 1.10% |
| 14 | 2710 | Refined Petroleum | $3,173,593,413.77 | 1.10% |
| 15 | 8414 | Air Pumps | $3,160,390,282.36 | 1.10% |
| 16 | 3004 | Packaged Medicaments | $3,117,570,507.88 | 1.10% |
| 17 | 1005 | Corn | $2,948,872,902.20 | 1.00% |
| 18 | 4011 | Rubber Tires | $2,908,966,981.94 | 0.99% |
| 19 | 8481 | Valves | $2,677,143,858.37 | 0.91% |
| 20 | 8538 | Electrical Power Accessories | $2,662,858,774.16 | 0.90% |
Who are the top countries of origin for Mexico ?
| Sr | Code | Country Name | Value of Imports | Percent of total |
| 1 | USA | United States | $137,814,098,650.80 | 47% |
| 2 | CHN | China | $49,992,254,448.55 | 17% |
| 3 | JPN | Japan | $14,382,067,703.75 | 4.90% |
| 4 | DEU | Germany | $12,520,728,485.39 | 4.20% |
| 5 | KOR | South Korea | $11,640,225,822.15 | 3.90% |
| 6 | CAN | Canada | $7,088,002,729.14 | 2.40% |
| 7 | ITA | Italy | $5,151,618,887.01 | 1.70% |
| 8 | ESP | Spain | $4,393,967,590.26 | 1.50% |
| 9 | BRA | Brazil | $4,130,212,045.89 | 1.40% |
| 10 | Other Asia | $3,945,055,127.81 | 1.30% | |
| 11 | NLD | Netherlands | $3,399,936,538.81 | 1.20% |
| 12 | THA | Thailand | $3,198,537,136.04 | 1.10% |
| 13 | FRA | France | $3,100,131,241.63 | 1.00% |
| 14 | MYS | Malaysia | $2,806,730,780.65 | 0.95% |
| 15 | IND | India | $2,197,113,467.14 | 0.74% |
| 16 | CRI | Costa Rica | $2,191,836,868.58 | 0.74% |
| 17 | GBR | United Kingdom | $2,128,575,181.42 | 0.72% |
| 18 | CHE | Switzerland | $1,516,044,246.59 | 0.51% |
| 19 | PHL | Philippines | $1,349,248,262.78 | 0.46% |
| 20 | CHL | Chile | $1,330,028,824.34 | 0.45% |
Statistics sourced from The Observatory of Economic Complexity.
Mexico continues to strengthen its local production capabilities, and diversify its export markets.
Are you looking to source products from Mexico ? Need guidance and linkages to export sources. Click here to send your questions.
![]()