Chile – Exports
What is the composition of Chile exports ?
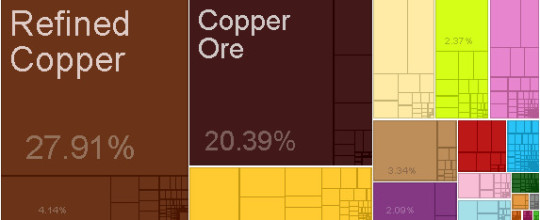
What are the top exports of Chile ?
| Sr | HS | Description | Value of Exports | Percent of total |
| 1 | 7403 | Refined Copper | $21,962,023,539.03 | 28% |
| 2 | 2603 | Copper Ore | $16,040,884,520.59 | 20% |
| 3 | 7402 | Raw Copper | $3,256,084,484.99 | 4.10% |
| 4 | 4703 | Sulfate Chemical Woodpulp | $2,627,703,249.85 | 3.30% |
| 5 | 2204 | Wine | $1,864,402,884.01 | 2.40% |
| 6 | 806 | Grapes | $1,825,574,876.11 | 2.30% |
| 7 | 304 | Fish Fillets | $1,732,555,927.17 | 2.20% |
| 8 | 7108 | Gold | $1,641,384,641.51 | 2.10% |
| 9 | 2601 | Iron Ore | $1,389,229,298.17 | 1.80% |
| 10 | 303 | Non-fillet Frozen Fish | $1,354,422,298.24 | 1.70% |
| 11 | 2613 | Molybdenum Ore | $1,225,154,286.13 | 1.60% |
| 12 | 2801 | Halogens | $998,462,214.25 | 1.30% |
| 13 | 808 | Apples and Pears | $927,442,142.99 | 1.20% |
| 14 | 809 | Pitted Fruits | $744,180,046.89 | 0.95% |
| 15 | 810 | Other Fruits | $714,759,713.33 | 0.91% |
| 16 | 2710 | Refined Petroleum | $683,396,005.18 | 0.87% |
| 17 | 3104 | Potassic Fertilizers | $602,436,129.28 | 0.77% |
| 18 | 7408 | Copper Wire | $501,848,346.70 | 0.64% |
| 19 | 7106 | Silver | $495,732,226.37 | 0.63% |
| 20 | 203 | Pig Meat | $471,591,589.77 | 0.60% |
What are the top markets for Chile ?
| Sr | Code | Country Name | Value of Imports | Percent of total | |
| 1 | CHN | China | $18,153,113,775.07 | 23% | |
| 2 | USA | United States | $9,590,216,820.90 | 12% | |
| 3 | JPN | Japan | $8,546,580,317.49 | 11% | |
| 4 | KOR | South Korea | $4,611,368,321.44 | 5.90% | |
| 5 | BRA | Brazil | $4,219,759,861.87 | 5.40% | |
| 6 | IND | India | $2,584,323,156.58 | 3.30% | |
| 7 | NLD | Netherlands | $2,315,620,227.04 | 2.90% | |
| 8 |
|
Italy | $2,035,082,023.67 | 2.60% | |
| 9 | Other Asia | $1,807,217,200.00 | 2.30% | ||
| 10 | ESP | Spain | $1,797,778,144.40 | 2.30% | |
| 11 | CAN | Canada | $1,518,922,388.76 | 1.90% | |
| 12 | PER | Peru | $1,467,646,683.59 | 1.90% | |
| 13 | DEU | Germany | $1,429,321,406.50 | 1.80% | |
| 14 | FRA | France | $1,347,328,200.19 | 1.70% | |
| 15 | MEX | Mexico | $1,330,028,824.34 | 1.70% | |
| 16 | AUS | Australia | $1,267,579,733.63 | 1.60% | |
| 17 | BLX | Belgium-Luxembourg | $1,242,164,916.81 | 1.60% | |
| 18 | BOL | Bolivia | $1,191,542,896.15 | 1.50% | |
| 19 | CHE | Switzerland | $1,112,993,750.53 | 1.40% | |
| 20 | ARG | Argentina | $1,023,998,016.16 | 1.30% |
Statistics sourced from The Observatory of Economic Complexity.
Chile continues to strengthen its local production capabilities, and diversify its export markets.
Are you looking to source products from Chile ? Need guidance and linkages to export sources. Click here to send your questions.
![]()