Peru – Exports
What is the composition of Peru exports ?
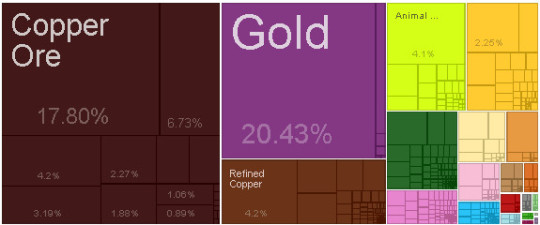
What are the top exports of Peru ?
| Sr | HS | Description | Value of Exports | Percent of total |
| 1 | 7108 | Gold | $9,686,018,794.48 | 20% |
| 2 | 2603 | Copper Ore | $8,436,958,222.95 | 18% |
| 3 | 2710 | Refined Petroleum | $3,190,735,825.60 | 6.70% |
| 4 | 2607 | Lead Ore | $1,990,383,424.28 | 4.20% |
| 5 | 7403 | Refined Copper | $1,989,752,089.02 | 4.20% |
| 6 | 2301 | Animal Meal and Pellets | $1,942,508,282.86 | 4.10% |
| 7 | 2711 | Petroleum Gas | $1,511,742,491.27 | 3.20% |
| 8 | 2608 | Zinc Ore | $1,076,136,147.92 | 2.30% |
| 9 | 901 | Coffee | $1,068,191,254.06 | 2.30% |
| 10 | 2601 | Iron Ore | $889,090,874.43 | 1.90% |
| 11 | 2616 | Precious Metal Ore | $636,548,381.80 | 1.30% |
| 12 | 2709 | Crude Petroleum | $589,492,315.38 | 1.20% |
| 13 | 6109 | Knit T-shirts | $550,660,752.00 | 1.20% |
| 14 | 7901 | Raw Zinc | $544,369,699.66 | 1.10% |
| 15 | 1504 | Fish Oil | $538,860,044.49 | 1.10% |
| 16 | 2510 | Calcium Phosphates | $502,110,306.41 | 1.10% |
| 17 | 7106 | Silver | $495,098,899.19 | 1.00% |
| 18 | 8001 | Raw Tin | $492,250,553.86 | 1.00% |
| 19 | 2613 | Molybdenum Ore | $424,236,462.61 | 0.89% |
| 20 | 2005 | Other Processed Vegetables | $402,839,251.18 | 0.85% |
What are the top markets for Peru ?
| Sr | Code | Country Name | Value of Exports | Percent of total |
| 1 | CHN | China | $7,892,751,188.79 | 17% |
| 2 | USA | United States | $6,546,679,600.24 | 14% |
| 3 | CHE | Switzerland | $5,126,340,826.46 | 11% |
| 4 | CAN | Canada | $3,560,812,626.84 | 7.50% |
| 5 | JPN | Japan | $2,627,102,985.03 | 5.50% |
| 6 | CHL | Chile | $2,040,923,285.24 | 4.30% |
| 7 | DEU | Germany | $1,971,831,507.91 | 4.20% |
| 8 | ESP | Spain | $1,925,556,037.24 | 4.10% |
| 9 | KOR | South Korea | $1,561,079,829.05 | 3.30% |
| 10 | BRA | Brazil | $1,390,829,821.06 | 2.90% |
| 11 | VEN | Venezuela | $1,210,165,379.00 | 2.60% |
| 12 | ECU | Ecuador | $1,107,952,530.55 | 2.30% |
| 13 | ITA | Italy | $1,046,355,990.08 | 2.20% |
| 14 | COL | Colombia | $921,856,065.98 | 1.90% |
| 15 | BLX | Belgium-Luxembourg | $689,886,954.01 | 1.50% |
| 16 | NLD | Netherlands | $672,480,118.03 | 1.40% |
| 17 | BOL | Bolivia | $566,179,640.51 | 1.20% |
| 18 | PAN | Panama | $496,219,882.00 | 1.00% |
| 19 | GBR | United Kingdom | $490,761,553.64 | 1.00% |
| 20 | IND | India | $475,302,297.09 | 1.00% |
Statistics sourced from The Observatory of Economic Complexity.
Peru continues to strengthen its local production capabilities, and diversify its export markets.
Are you looking to source products from Peru ? Need guidance and linkages to export sources. Click here to send your questions.
![]()