Tanzania – Exports
What is the composition of Tanzania exports ?
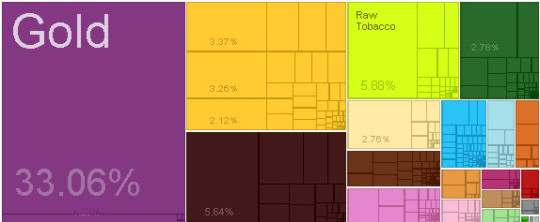
What are the top exports of Tanzania ?
| Sr | HS | Description | Value of Exports | Percent of total |
| 1 | 7108 | Gold | $1,841,878,333.72 | 33% |
| 2 | 2401 | Raw Tobacco | $327,595,880.36 | 5.90% |
| 3 | 2616 | Precious Metal Ore | $314,129,441.84 | 5.60% |
| 4 | 901 | Coffee | $187,865,188.22 | 3.40% |
| 5 | 801 | Coconuts, Brazil Nuts, and Cashews | $181,742,494.57 | 3.30% |
| 6 | 5201 | Raw Cotton | $154,985,435.17 | 2.80% |
| 7 | 304 | Fish Fillets | $154,047,423.08 | 2.80% |
| 8 | 1207 | Other Oily Seeds | $118,064,090.20 | 2.10% |
| 9 | 2603 | Copper Ore | $110,402,493.60 | 2.00% |
| 10 | 713 | Dried Legumes | $73,666,423.60 | 1.30% |
| 11 | 7103 | Precious Stones | $68,583,195.50 | 1.20% |
| 12 | 907 | Cloves | $64,498,186.63 | 1.20% |
| 13 | 2602 | Manganese Ore | $61,652,961.51 | 1.10% |
| 14 | 2306 | Other Vegetable Residues | $58,934,930.95 | 1.10% |
| 15 | 6304 | Bedspreads | $55,518,142.23 | 1.00% |
| 16 | 3105 | Mixed Mineral or Chemical Fertilizers | $52,462,191.77 | 0.94% |
| 17 | 902 | Tea | $49,964,629.49 | 0.90% |
| 18 | 1101 | Wheat Flours | $43,104,092.31 | 0.77% |
| 19 | 2710 | Refined Petroleum | $42,441,461.97 | 0.76% |
| 20 | 8802 | Planes, Helicopters, and/or Spacecraft | $39,344,426.89 | 0.71% |
What are the top markets for Tanzania ?
| Sr | Code | Country Name | Value of Exports | Percent of total |
| 1 | ZAF | South Africa | $1,073,419,603.36 | 19% |
| 2 | CHE | Switzerland | $810,736,613.56 | 15% |
| 3 | IND | India | $475,895,219.69 | 8.50% |
| 4 | CHN | China | $463,065,296.71 | 8.30% |
| 5 | KEN | Kenya | $347,508,357.00 | 6.20% |
| 6 | DEU | Germany | $233,733,382.64 | 4.20% |
| 7 | JPN | Japan | $231,286,743.61 | 4.20% |
| 8 | COD | Democratic Republic of the Congo | $187,194,403.00 | 3.40% |
| 9 | USA | United States | $127,769,227.98 | 2.30% |
| 10 | NLD | Netherlands | $123,405,600.38 | 2.20% |
| 11 | RWA | Rwanda | $121,970,310.14 | 2.20% |
| 12 | MWI | Malawi | $104,099,843.00 | 1.90% |
| 13 | ARE | United Arab Emirates | $87,818,837.00 | 1.60% |
| 14 | ZMB | Zambia | $81,576,388.00 | 1.50% |
| 15 | MOZ | Mozambique | $62,159,756.28 | 1.10% |
| 16 | IDN | Indonesia | $62,089,419.36 | 1.10% |
| 17 | GBR | United Kingdom | $61,710,589.04 | 1.10% |
| 18 | UGA | Uganda | $60,309,907.15 | 1.10% |
| 19 | BLX | Belgium-Luxembourg | $60,261,879.38 | 1.10% |
| 20 | BDI | Burundi | $55,950,695.01 | 1.00% |
Statistics sourced from The Observatory of Economic Complexity.
Tanzania continues to strengthen its local production capabilities, and diversify its export markets.
Are you looking to source products from Tanzania ? Need guidance and linkages to export sources. Click here to send your questions.
![]()