Japan – Exports
What is the composition of Japan exports ?
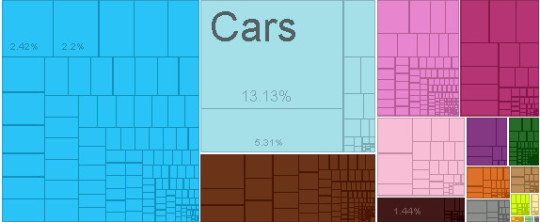
What are the top exports of Japan ?
| Sr | HS | Description | Value of Exports | Percent of total |
| 1 | 8703 | Cars | $104,286,673,342.70 | 13% |
| 2 | 8708 | Vehicle Parts | $42,212,949,837.04 | 5.30% |
| 3 | 8542 | Integrated Circuits | $19,192,867,751.34 | 2.40% |
| 4 | 8443 | Industrial Printers | $17,465,913,958.25 | 2.20% |
| 5 | 8479 | Machinery Having Individual Functions | $13,577,743,699.58 | 1.70% |
| 6 | 8429 | Large Construction Vehicles | $13,249,233,697.45 | 1.70% |
| 7 | 8704 | Delivery Trucks | $12,243,144,948.83 | 1.50% |
| 8 | 2710 | Refined Petroleum | $11,451,053,384.55 | 1.40% |
| 9 | 8521 | Video Recording Equipment | $11,207,592,746.00 | 1.40% |
| 10 | 8536 | Low-voltage Protection Equipment | $10,141,712,459.47 | 1.30% |
| 11 | 7208 | Hot-Rolled Iron | $10,094,917,375.18 | 1.30% |
| 12 | 8409 | Engine Parts | $9,293,228,300.00 | 1.20% |
| 13 | 4011 | Rubber Tires | $8,828,718,567.07 | 1.10% |
| 14 | 9013 | LCDs | $8,241,300,101.17 | 1.00% |
| 15 | 8541 | Semiconductor Devices | $8,146,892,634.98 | 1.00% |
| 16 | 9010 | Photo Lab Equipment | $8,021,208,686.54 | 1.00% |
| 17 | 3920 | Raw Plastic Sheeting | $7,608,033,927.48 | 0.96% |
| 18 | 2902 | Cyclic Hydrocarbons | $7,320,531,234.16 | 0.92% |
| 19 | 8414 | Air Pumps | $6,602,711,853.93 | 0.83% |
| 20 | 9001 | Optical Fibers | $6,534,848,373.96 | 0.82% |
What are the top markets for Japan ?
| Sr | Code | Country Name | Value of Exports | Percent of total |
| 1 | CHN | China | $147,373,438,686.21 | 19% |
| 2 | USA | United States | $140,103,881,763.92 | 18% |
| 3 | KOR | South Korea | $62,023,946,094.84 | 7.80% |
| 4 | THA | Thailand | $43,071,041,462.34 | 5.40% |
| 5 | Other Asia | $37,545,569,613.00 | 4.70% | |
| 6 | HKG | Hong Kong | $34,261,745,535.77 | 4.30% |
| 7 | DEU | Germany | $26,507,830,695.77 | 3.30% |
| 8 | IDN | Indonesia | $20,389,830,756.72 | 2.60% |
| 9 | AUS | Australia | $19,620,079,120.33 | 2.50% |
| 10 | SGP | Singapore | $19,346,680,914.05 | 2.40% |
| 11 | MYS | Malaysia | $17,229,448,826.09 | 2.20% |
| 12 | MEX | Mexico | $14,382,067,703.75 | 1.80% |
| 13 | RUS | Russia | $14,324,345,311.11 | 1.80% |
| 14 | CAN | Canada | $14,217,125,539.93 | 1.80% |
| 15 | GBR | United Kingdom | $13,441,408,056.13 | 1.70% |
| 16 | NLD | Netherlands | $13,002,248,395.41 | 1.60% |
| 17 | IND | India | $11,150,999,239.43 | 1.40% |
| 18 | FRA | France | $10,667,366,152.14 | 1.30% |
| 19 | VNM | Vietnam | $9,591,933,804.15 | 1.20% |
| 20 | BLX | Belgium-Luxembourg | $8,916,233,249.95 | 1.10% |
Statistics sourced from The Observatory of Economic Complexity.
Japan continues to strengthen its local production capabilities, and diversify its export markets.
Are you looking to source products from Japan ? Need guidance and linkages to export sources. Click here to send your questions.
![]()