Mexico – Exports
What is the composition of Mexico exports ?
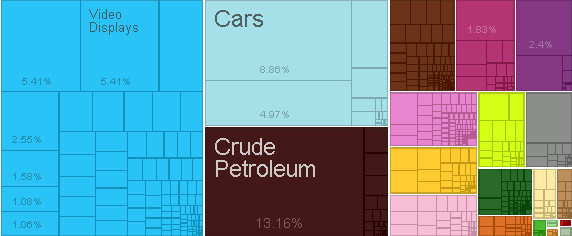
What are the top exports of Mexico ?
| Sr | HS | Description | Value of Exports | Percent of total |
| 1 | 2709 | Crude Petroleum | $45,907,721,592.53 | 13% |
| 2 | 8703 | Cars | $30,901,173,968.90 | 8.90% |
| 3 | 8471 | Computers | $18,885,629,835.93 | 5.40% |
| 4 | 8528 | Video Displays | $18,880,773,570.34 | 5.40% |
| 5 | 8704 | Delivery Trucks | $17,324,019,999.61 | 5.00% |
| 6 | 8517 | Telephones | $10,105,377,060.89 | 2.90% |
| 7 | 8544 | Insulated Wire | $8,901,920,726.90 | 2.60% |
| 8 | 7108 | Gold | $8,379,885,040.19 | 2.40% |
| 9 | 8701 | Tractors | $6,489,674,823.83 | 1.90% |
| 10 | 9018 | Medical Instruments | $6,385,446,609.44 | 1.80% |
| 11 | 9401 | Seats | $6,225,647,825.48 | 1.80% |
| 12 | 8525 | Broadcasting Equipment | $5,510,760,000.86 | 1.60% |
| 13 | 7106 | Silver | $4,465,818,284.20 | 1.30% |
| 14 | 8409 | Engine Parts | $3,765,012,832.27 | 1.10% |
| 15 | 8418 | Refrigerators | $3,704,659,236.90 | 1.10% |
| 16 | 8536 | Low-voltage Protection Equipment | $3,481,236,643.04 | 1.00% |
| 17 | 8537 | Electrical Control Boards | $3,303,464,100.26 | 0.95% |
| 18 | 8501 | Electric Motors | $3,030,032,532.93 | 0.87% |
| 19 | 8708 | Vehicle Parts | $2,880,819,565.19 | 0.83% |
| 20 | 8407 | Spark-Ignition Engines | $2,859,583,441.87 | 0.82% |
What are the top markets for Mexico ?
| Sr | Code | Country Name | Value of Exports | Percent of total |
| 1 | USA | United States | $244,861,600,371.62 | 70% |
| 2 | CAN | Canada | $18,959,383,365.43 | 5.40% |
| 3 | ESP | Spain | $7,403,887,971.33 | 2.10% |
| 4 | CHN | China | $6,937,111,183.27 | 2.00% |
| 5 | COL | Colombia | $6,212,288,552.46 | 1.80% |
| 6 | BRA | Brazil | $5,947,299,712.50 | 1.70% |
| 7 | DEU | Germany | $5,366,347,015.76 | 1.50% |
| 8 | JPN | Japan | $3,928,073,657.48 | 1.10% |
| 9 | IND | India | $3,508,153,387.67 | 1.00% |
| 10 | GBR | United Kingdom | $3,147,239,167.65 | 0.90% |
| 11 | CHL | Chile | $2,582,829,678.85 | 0.74% |
| 12 | KOR | South Korea | $2,332,736,181.91 | 0.67% |
| 13 | ARG | Argentina | $2,213,222,480.13 | 0.63% |
| 14 | NLD | Netherlands | $2,098,441,194.53 | 0.60% |
| 15 | VEN | Venezuela | $2,027,454,443.00 | 0.58% |
| 16 | AUS | Australia | $1,919,362,564.68 | 0.55% |
| 17 | GTM | Guatemala | $1,832,878,102.07 | 0.53% |
| 18 | BLX | Belgium-Luxembourg | $1,766,493,194.99 | 0.51% |
| 19 | PER | Peru | $1,729,038,344.32 | 0.50% |
| 20 | FRA | France | $1,651,984,548.26 | 0.47% |
Statistics sourced from The Observatory of Economic Complexity.
Mexico continues to strengthen its local production capabilities, and diversify its export markets.
Are you looking to source products from Mexico ? Need guidance and linkages to export sources. Click here to send your questions.
![]()