India – Exports
What is the composition of India exports ?
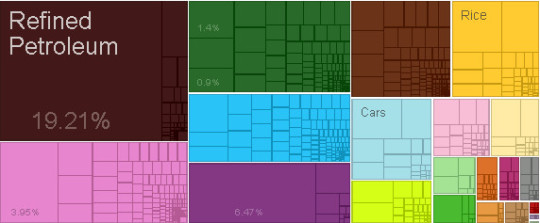
What are the top exports of India ?
| Sr | HS | Description | Value of Exports | Percent of total |
| 1 | 2710 | Refined Petroleum | $52,905,348,638.22 | 19% |
| 2 | 7113 | Jewellery | $17,814,769,675.60 | 6.50% |
| 3 | 3004 | Packaged Medicaments | $10,886,935,434.27 | 4.00% |
| 4 | 1006 | Rice | $6,109,790,267.63 | 2.20% |
| 5 | 8703 | Cars | $4,828,715,986.31 | 1.80% |
| 6 | 1302 | Vegetable Saps | $4,430,766,156.74 | 1.60% |
| 7 | 5201 | Raw Cotton | $3,857,985,946.62 | 1.40% |
| 8 | 8525 | Broadcasting Equipment | $3,482,023,137.92 | 1.30% |
| 9 | 2601 | Iron Ore | $3,212,251,004.09 | 1.20% |
| 10 | 5205 | Non-Retail Pure Cotton Yarn | $3,211,432,963.98 | 1.20% |
| 11 | 8708 | Vehicle Parts | $2,870,101,783.74 | 1.00% |
| 12 | 202 | Frozen Bovine Meat | $2,746,224,382.30 | 1.00% |
| 13 | 2933 | Nitrogen Heterocyclic Compounds | $2,710,759,533.28 | 0.98% |
| 14 | 6204 | Non-Knit Women’s Suits | $2,476,672,755.41 | 0.90% |
| 15 | 7102 | Diamonds | $2,411,193,488.97 | 0.88% |
| 16 | 2902 | Cyclic Hydrocarbons | $2,292,669,673.42 | 0.83% |
| 17 | 7403 | Refined Copper | $2,248,924,923.12 | 0.82% |
| 18 | 1701 | Raw Sugar | $2,104,319,232.47 | 0.76% |
| 19 | 2304 | Soybean Meal | $2,035,238,420.96 | 0.74% |
| 20 | 6302 | House Linens | $1,999,226,077.31 | 0.73% |
What are the top markets for India ?
| Sr | Code | Country Name | Value of Exports | Percent of total |
| 1 | USA | United States | $33,811,429,974.77 | 12% |
| 2 | ARE | United Arab Emirates | $31,911,339,483.00 | 12% |
| 3 | CHN | China | $16,059,722,923.95 | 5.80% |
| 4 | SGP | Singapore | $12,343,587,100.73 | 4.50% |
| 5 | GBR | United Kingdom | $9,168,849,655.03 | 3.30% |
| 6 | DEU | Germany | $8,884,659,486.73 | 3.20% |
| 7 | SAU | Saudi Arabia | $8,522,569,306.00 | 3.10% |
| 8 | KOR | South Korea | $6,563,275,534.04 | 2.40% |
| 9 | JPN | Japan | $6,378,462,854.88 | 2.30% |
| 10 | NLD | Netherlands | $6,147,979,291.25 | 2.20% |
| 11 | FRA | France | $5,900,031,674.92 | 2.10% |
| 12 | TUR | Turkey | $5,522,869,945.18 | 2.00% |
| 13 | BRA | Brazil | $5,078,407,501.50 | 1.80% |
| 14 | BGD | Bangladesh | $4,879,081,278.00 | 1.80% |
| 15 | ZAF | South Africa | $4,820,661,766.22 | 1.80% |
| 16 | ITA | Italy | $4,807,429,668.10 | 1.70% |
| 17 | IDN | Indonesia | $4,477,608,603.89 | 1.60% |
| 18 | MYS | Malaysia | $3,765,589,334.86 | 1.40% |
| 19 | KEN | Kenya | $3,752,292,576.00 | 1.40% |
| 20 | BLX | Belgium-Luxembourg | $3,621,775,332.48 | 1.30% |
Statistics sourced from The Observatory of Economic Complexity.
India continues to strengthen its local production capabilities, and diversify its export markets.
Are you looking to source products from India ? Need guidance and linkages to export sources. Click here to send your questions.
![]()