


China – Imports
 Imports of China
What is the composition of China’s imports?
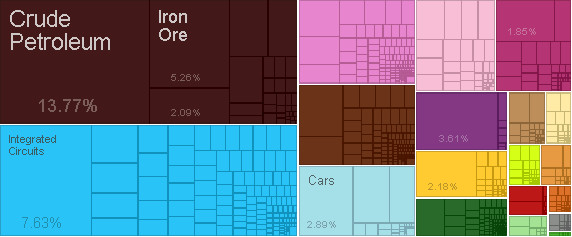
What are the top imports of China ?
| Sr | HS | Description | Value of Exports | Percent of total |
| 1 | 2710 | Refined Petroleum | $7,635,567,885.58 | 10% |
| 2 | 2709 | Crude Petroleum | $5,700,254,667.58 | 7.50% |
| 3 | 8703 | Cars | $3,773,440,829.28 | 5.00% |
| 4 | 8704 | Delivery Trucks | $3,005,691,279.10 | 3.90% |
| 5 | 8802 | Planes, Helicopters, and/or Spacecraft | $2,880,270,018.65 | 3.80% |
| 6 | 2711 | Petroleum Gas | $2,028,463,530.21 | 2.70% |
| 7 | 8525 | Broadcasting Equipment | $1,505,009,150.36 | 2.00% |
| 8 | 8471 | Computers | $1,480,667,326.96 | 1.90% |
| 9 | 8429 | Large Construction Vehicles | $1,234,133,654.62 | 1.60% |
| 10 | 4011 | Rubber Tires | $1,016,800,550.59 | 1.30% |
| 11 | 2701 | Coal Briquettes | $940,553,147.26 | 1.20% |
| 12 | 8528 | Video Displays | $877,589,748.12 | 1.20% |
| 13 | 8708 | Vehicle Parts | $788,955,511.73 | 1.00% |
| 14 | 201 | Bovine Meat | $783,722,772.06 | 1.00% |
| 15 | 8517 | Telephones | $701,948,131.80 | 0.92% |
| 16 | 3004 | Packaged Medicaments | $628,607,679.78 | 0.83% |
| 17 | 8431 | Excavation Machinery | $609,234,636.18 | 0.80% |
| 18 | 8474 | Stone Processing Machines | $567,906,293.32 | 0.75% |
| 19 | 3901 | Ethylene Polymers | $540,414,256.55 | 0.71% |
| 20 | 8702 | Buses | $524,713,011.70 | 0.69% |
Who are the top countries of origin for China ?
| Sr | Code | Country Name | Value of Exports | Percent of total |
| 1 | USA | United States | $17,368,102,248.66 | 23% |
| 2 | CHN | China | $13,911,419,679.02 | 18% |
| 3 | BRA | Brazil | $4,874,976,804.21 | 6.40% |
| 4 | ARG | Argentina | $4,454,172,999.50 | 5.80% |
| 5 | DEU | Germany | $3,439,946,600.76 | 4.50% |
| 6 | MEX | Mexico | $2,582,829,678.85 | 3.40% |
| 7 | KOR | South Korea | $2,541,955,669.43 | 3.30% |
| 8 | JPN | Japan | $2,471,123,940.93 | 3.20% |
| 9 | COL | Colombia | $2,191,564,002.28 | 2.90% |
| 10 | PER | Peru | $2,040,923,285.24 | 2.70% |
| 11 | ECU | Ecuador | $1,947,453,658.76 | 2.60% |
| 12 | XXA | Areas | $1,861,215,738.96 | 2.40% |
| 13 | FRA | France | $1,531,513,615.02 | 2.00% |
| 14 | ESP | Spain | $1,387,957,828.41 | 1.80% |
| 15 | TTO | Trinidad and Tobago | $1,296,562,091.21 | 1.70% |
| 16 | ITA | Italy | $1,250,248,285.91 | 1.60% |
| 17 | GBR | United Kingdom | $993,759,272.38 | 1.30% |
| 18 | CAN | Canada | $970,269,716.57 | 1.30% |
| 19 | IND | India | $727,560,034.20 | 0.96% |
| 20 | THA | Thailand | $701,121,223.49 | 0.92% |
Statistics sourced from The Observatory of Economic Complexity.
China continues to strengthen its local production capabilities, and diversify its export markets.
Are you looking to source products from China ? Need guidance and linkages to export sources. Click here to send your questions.
![]()