


Peru – Imports
 Imports of Peru
What is the composition of Peru’s imports?
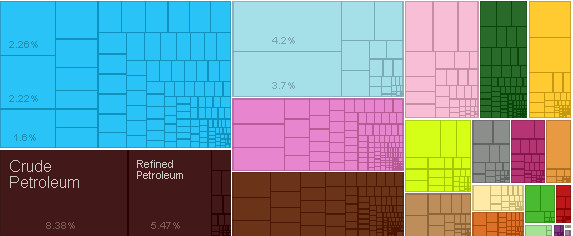
What are the top imports of Peru ?
| Sr | HS | Value of Exports | Percent of total | |
| 1 | 2709 | Crude Petroleum | $3,523,456,218.09 | 8.40% |
| 2 | 2710 | Refined Petroleum | $2,300,128,048.26 | 5.50% |
| 3 | 8703 | Cars | $1,764,940,317.11 | 4.20% |
| 4 | 8704 | Delivery Trucks | $1,553,637,067.06 | 3.70% |
| 5 | 8429 | Large Construction Vehicles | $948,832,545.84 | 2.30% |
| 6 | 8471 | Computers | $933,237,809.06 | 2.20% |
| 7 | 8525 | Broadcasting Equipment | $674,158,069.92 | 1.60% |
| 8 | 1001 | Wheat | $508,805,514.41 | 1.20% |
| 9 | 8528 | Video Displays | $507,812,624.24 | 1.20% |
| 10 | 1005 | Corn | $491,665,660.06 | 1.20% |
| 11 | 4011 | Rubber Tires | $450,442,753.21 | 1.10% |
| 12 | 2304 | Soybean Meal | $437,759,400.06 | 1.00% |
| 13 | 8701 | Tractors | $408,209,712.05 | 0.97% |
| 14 | 3102 | Nitrogenous Fertilizers | $402,776,328.97 | 0.96% |
| 15 | 3901 | Ethylene Polymers | $401,217,769.86 | 0.95% |
| 16 | 1507 | Soybean Oil | $400,407,110.15 | 0.95% |
| 17 | 3823 | Industrial Fatty Acids, Oils and Alcohols | $392,808,675.87 | 0.93% |
| 18 | 8517 | Telephones | $390,202,984.29 | 0.93% |
| 19 | 3004 | Packaged Medicaments | $372,288,468.26 | 0.89% |
| 20 | 8702 | Buses | $366,608,231.89 | 0.87% |
Who are the top countries of origin for Peru ?
| Sr | Code | Country Name | Value of Imports | Percent of total |
| 1 | USA | United States | $7,856,094,891.75 | 19% |
| 2 | CHN | China | $7,678,899,788.95 | 18% |
| 3 | BRA | Brazil | $2,519,353,710.30 | 6.00% |
| 4 | ECU | Ecuador | $2,024,679,862.63 | 4.80% |
| 5 | ARG | Argentina | $1,977,197,006.39 | 4.70% |
| 6 | MEX | Mexico | $1,729,038,344.32 | 4.10% |
| 7 | KOR | South Korea | $1,622,040,883.15 | 3.90% |
| 8 | COL | Colombia | $1,592,036,064.65 | 3.80% |
| 9 | CHL | Chile | $1,467,646,683.59 | 3.50% |
| 10 | JPN | Japan | $1,465,809,149.55 | 3.50% |
| 11 | DEU | Germany | $1,352,843,042.10 | 3.20% |
| 12 | NGA | Nigeria | $796,231,517.43 | 1.90% |
| 13 | ESP | Spain | $774,232,086.71 | 1.80% |
| 14 | IND | India | $745,877,280.69 | 1.80% |
| 15 | ITA | Italy | $685,129,244.50 | 1.60% |
| 16 | CAN | Canada | $610,800,291.87 | 1.50% |
| 17 | BOL | Bolivia | $463,165,689.93 | 1.10% |
| 18 | THA | Thailand | $447,747,941.86 | 1.10% |
| 19 | Other Asia | $445,388,477.14 | 1.10% | |
| 20 | SWE | Sweden | $396,571,226.49 | 0.94% |
Statistics sourced from The Observatory of Economic Complexity.
Peru continues to strengthen its local production capabilities, and diversify its export markets.
Are you looking to source products from Peru ? Need guidance and linkages to export sources. Click here to send your questions.
![]()