


India – Imports

What is the composition of India’s imports?
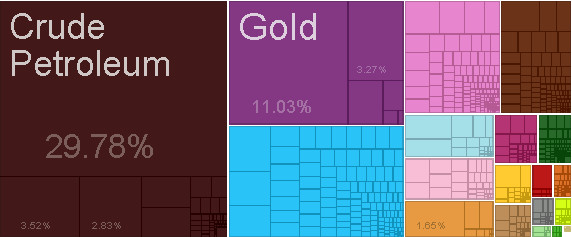
What are the top imports of India ?
| Sr | HS | Description | Value of Exports | Percent of total |
| 1 | 2709 | Crude Petroleum | $133,378,245,867.84 | 30% |
| 2 | 7108 | Gold | $49,382,115,124.99 | 11% |
| 3 | 2701 | Coal Briquettes | $15,757,271,686.43 | 3.50% |
| 4 | 7102 | Diamonds | $14,633,290,967.38 | 3.30% |
| 5 | 2711 | Petroleum Gas | $12,664,881,027.19 | 2.80% |
| 6 | 1511 | Palm Oil | $7,389,102,311.04 | 1.60% |
| 7 | 8517 | Telephones | $6,424,774,594.26 | 1.40% |
| 8 | 7113 | Jewellery | $5,177,602,186.32 | 1.20% |
| 9 | 2603 | Copper Ore | $5,124,252,640.88 | 1.10% |
| 10 | 8471 | Computers | $4,752,074,644.79 | 1.10% |
| 11 | 2710 | Refined Petroleum | $4,698,908,566.59 | 1.00% |
| 12 | 8525 | Broadcasting Equipment | $4,504,899,488.75 | 1.00% |
| 13 | 8708 | Vehicle Parts | $3,993,201,130.48 | 0.89% |
| 14 | 7204 | Scrap Iron | $3,941,647,099.31 | 0.88% |
| 15 | 3105 | Mixed Mineral or Chemical Fertilizers | $3,814,595,268.43 | 0.85% |
| 16 | 8905 | Special Purpose Ships | $2,880,241,977.36 | 0.64% |
| 17 | 3102 | Nitrogenous Fertilizers | $2,786,726,181.02 | 0.62% |
| 18 | 2902 | Cyclic Hydrocarbons | $2,256,814,377.75 | 0.50% |
| 19 | 713 | Dried Legumes | $2,107,198,920.16 | 0.47% |
| 20 | 7106 | Silver | $2,057,412,578.55 | 0.46% |
Who are the top countries of origin for India ?
| Sr | Code | Country Name | Value of Imports | Percent of total |
| 1 | CHN | China | $47,971,242,851.36 | 11% |
| 2 | ARE | United Arab Emirates | $33,460,219,897.61 | 7.50% |
| 3 | SAU | Saudi Arabia | $29,151,085,721.09 | 6.50% |
| 4 | CHE | Switzerland | $27,958,008,683.63 | 6.20% |
| 5 | USA | United States | $18,953,648,083.39 | 4.20% |
| 6 | IRQ | Iraq | $17,205,658,201.69 | 3.80% |
| 7 | KWT | Kuwait | $15,780,819,239.02 | 3.50% |
| 8 | QAT | Qatar | $14,740,416,607.01 | 3.30% |
| 9 | NGA | Nigeria | $14,078,834,599.63 | 3.10% |
| 10 | DEU | Germany | $13,529,379,983.02 | 3.00% |
| 11 | AUS | Australia | $13,110,129,763.79 | 2.90% |
| 12 | KOR | South Korea | $13,084,803,400.36 | 2.90% |
| 13 | IDN | Indonesia | $12,857,290,064.93 | 2.90% |
| 14 | IRN | Iran | $11,851,570,817.25 | 2.60% |
| 15 | JPN | Japan | $11,150,999,239.43 | 2.50% |
| 16 | VEN | Venezuela | $10,337,645,573.83 | 2.30% |
| 17 | BLX | Belgium-Luxembourg | $9,892,538,050.12 | 2.20% |
| 18 | MYS | Malaysia | $9,500,415,502.59 | 2.10% |
| 19 | ZAF | South Africa | $9,089,122,323.84 | 2.00% |
| 20 | SGP | Singapore | $7,790,473,156.55 | 1.70% |
Statistics sourced from The Observatory of Economic Complexity.
India continues to strengthen its local production capabilities, and diversify its export markets.
Are you looking to source products from India ? Need guidance and linkages to export sources. Click here to send your questions.
![]()