Germany – Exports
What is the composition of Germany exports ?
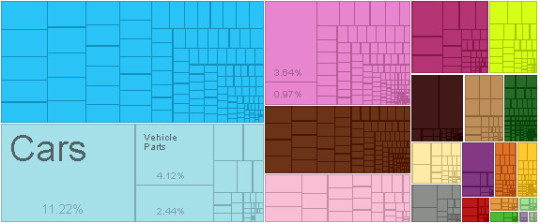
What are the top exports of Germany ?
| Sr | HS | Description | Value of Exports | Percent of total |
| 1 | 8703 | Cars | $148,350,860,004.79 | 11% |
| 2 | 8708 | Vehicle Parts | $54,509,484,502.09 | 4.10% |
| 3 | 3004 | Packaged Medicaments | $48,170,381,436.84 | 3.60% |
| 4 | 8802 | Planes, Helicopters, and/or Spacecraft | $32,267,611,085.39 | 2.40% |
| 5 | 2710 | Refined Petroleum | $17,535,754,461.59 | 1.30% |
| 6 | 2711 | Petroleum Gas | $15,038,875,761.56 | 1.10% |
| 7 | 8409 | Engine Parts | $14,414,048,130.29 | 1.10% |
| 8 | 8479 | Machinery Having Individual Functions | $13,773,279,831.07 | 1.00% |
| 9 | 9018 | Medical Instruments | $12,779,983,809.20 | 0.97% |
| 10 | 3002 | Human or Animal Blood | $12,761,073,177.23 | 0.97% |
| 11 | 8471 | Computers | $12,407,985,109.22 | 0.94% |
| 12 | 8704 | Delivery Trucks | $11,961,434,382.70 | 0.90% |
| 13 | 8483 | Transmissions | $11,487,151,525.52 | 0.87% |
| 14 | 8542 | Integrated Circuits | $11,485,798,415.04 | 0.87% |
| 15 | 8481 | Valves | $11,449,880,564.60 | 0.87% |
| 16 | 8536 | Low-voltage Protection Equipment | $11,363,412,798.16 | 0.86% |
| 17 | 7108 | Gold | $11,037,656,036.16 | 0.83% |
| 18 | 8413 | Liquid Pumps | $10,965,909,738.36 | 0.83% |
| 19 | 8421 | Centrifuges | $10,203,633,176.45 | 0.77% |
| 20 | 8411 | Gas Turbines | $9,238,853,598.43 | 0.70% |
What are the top markets for Germany ?
| Sr | Code | Country Name | Value of Exports | Percent of total |
| 1 | FRA | France | $116,442,805,543.86 | 8.80% |
| 2 | USA | United States | $107,607,675,487.21 | 8.10% |
| 3 | CHN | China | $83,972,898,111.20 | 6.40% |
| 4 | GBR | United Kingdom | $82,128,275,606.01 | 6.20% |
| 5 | NLD | Netherlands | $77,202,922,705.38 | 5.80% |
| 6 | ITA | Italy | $68,294,891,084.16 | 5.20% |
| 7 | BLX | Belgium-Luxembourg | $63,293,491,195.47 | 4.80% |
| 8 | AUT | Austria | $62,793,621,961.52 | 4.70% |
| 9 | CHE | Switzerland | $59,501,074,896.97 | 4.50% |
| 10 | RUS | Russia | $46,523,494,507.04 | 3.50% |
| 11 | POL | Poland | $42,843,623,136.17 | 3.20% |
| 12 | ESP | Spain | $35,665,001,621.04 | 2.70% |
| 13 | CZE | Czech Republic | $35,489,754,621.76 | 2.70% |
| 14 | SWE | Sweden | $26,860,112,731.39 | 2.00% |
| 15 | JPN | Japan | $22,961,872,107.64 | 1.70% |
| 16 | TUR | Turkey | $22,947,010,086.21 | 1.70% |
| 17 | HUN | Hungary | $19,917,506,746.67 | 1.50% |
| 18 | DNK | Denmark | $18,671,398,028.91 | 1.40% |
| 19 | KOR | South Korea | $17,348,508,113.86 | 1.30% |
| 20 | BRA | Brazil | $14,773,277,565.79 | 1.10% |
Statistics sourced from The Observatory of Economic Complexity.
Germany continues to strengthen its local production capabilities, and diversify its export markets.
Are you looking to source products from Germany ? Need guidance and linkages to export sources. Click here to send your questions.
![]()