China – Exports
What is the composition of China exports ?
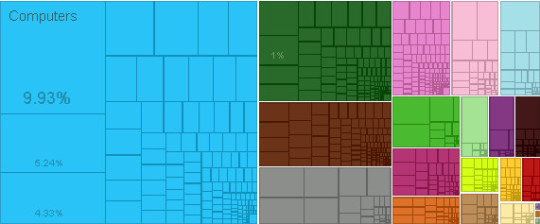
What are the top exports of China ?
| Sr | HS | Description | Value of Exports | Percent of total |
| 1 | 7403 | Refined Copper | $21,962,023,539.03 | 28% |
| 2 | 2603 | Copper Ore | $16,040,884,520.59 | 20% |
| 3 | 7402 | Raw Copper | $3,256,084,484.99 | 4.10% |
| 4 | 4703 | Sulfate Chemical Woodpulp | $2,627,703,249.85 | 3.30% |
| 5 | 2204 | Wine | $1,864,402,884.01 | 2.40% |
| 6 | 806 | Grapes | $1,825,574,876.11 | 2.30% |
| 7 | 304 | Fish Fillets | $1,732,555,927.17 | 2.20% |
| 8 | 7108 | Gold | $1,641,384,641.51 | 2.10% |
| 9 | 2601 | Iron Ore | $1,389,229,298.17 | 1.80% |
| 10 | 303 | Non-fillet Frozen Fish | $1,354,422,298.24 | 1.70% |
| 11 | 2613 | Molybdenum Ore | $1,225,154,286.13 | 1.60% |
| 12 | 2801 | Halogens | $998,462,214.25 | 1.30% |
| 13 | 808 | Apples and Pears | $927,442,142.99 | 1.20% |
| 14 | 809 | Pitted Fruits | $744,180,046.89 | 0.95% |
| 15 | 810 | Other Fruits | $714,759,713.33 | 0.91% |
| 16 | 2710 | Refined Petroleum | $683,396,005.18 | 0.87% |
| 17 | 3104 | Potassic Fertilizers | $602,436,129.28 | 0.77% |
| 18 | 7408 | Copper Wire | $501,848,346.70 | 0.64% |
| 19 | 7106 | Silver | $495,732,226.37 | 0.63% |
| 20 | 203 | Pig Meat | $471,591,589.77 | 0.60% |
What are the top markets for China ?
| Sr | Code | Country Name | Value of Imports | Percent of total | |
| 1 | CHN | China | $18,153,113,775.07 | 23% | |
| 2 | USA | United States | $9,590,216,820.90 | 12% | |
| 3 | JPN | Japan | $8,546,580,317.49 | 11% | |
| 4 | KOR | South Korea | $4,611,368,321.44 | 5.90% | |
| 5 | BRA | Brazil | $4,219,759,861.87 | 5.40% | |
| 6 | IND | India | $2,584,323,156.58 | 3.30% | |
| 7 | NLD | Netherlands | $2,315,620,227.04 | 2.90% | |
| 8 |
|
Italy | $2,035,082,023.67 | 2.60% | |
| 9 | Other Asia | $1,807,217,200.00 | 2.30% | ||
| 10 | ESP | Spain | $1,797,778,144.40 | 2.30% | |
| 11 | CAN | Canada | $1,518,922,388.76 | 1.90% | |
| 12 | PER | Peru | $1,467,646,683.59 | 1.90% | |
| 13 | DEU | Germany | $1,429,321,406.50 | 1.80% | |
| 14 | FRA | France | $1,347,328,200.19 | 1.70% | |
| 15 | MEX | Mexico | $1,330,028,824.34 | 1.70% | |
| 16 | AUS | Australia | $1,267,579,733.63 | 1.60% | |
| 17 | BLX | Belgium-Luxembourg | $1,242,164,916.81 | 1.60% | |
| 18 | BOL | Bolivia | $1,191,542,896.15 | 1.50% | |
| 19 | CHE | Switzerland | $1,112,993,750.53 | 1.40% | |
| 20 | ARG | Argentina | $1,023,998,016.16 | 1.30% |
Statistics sourced from The Observatory of Economic Complexity.
China continues to strengthen its local production capabilities, and diversify its export markets.
Are you looking to source products from China? Need guidance and linkages to export sources. Click here to send your questions.
![]()