


Canada – Imports
 Imports of Canada
What is the composition of Canada’s imports?
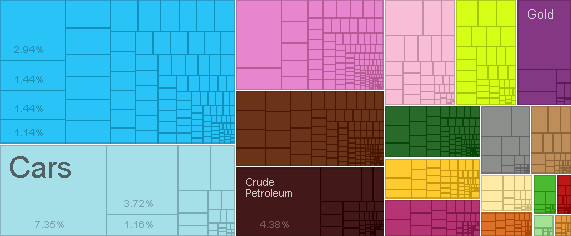
What are the top imports of Canada ?
| Sr | HS | Description | Value of Exports | Percent of total |
| 1 | 8703 | Cars | $25,685,327,703.08 | 7.40% |
| 2 | 2709 | Crude Petroleum | $15,309,140,535.37 | 4.40% |
| 3 | 8704 | Delivery Trucks | $13,007,378,689.13 | 3.70% |
| 4 | 8471 | Computers | $10,285,767,038.22 | 2.90% |
| 5 | 7108 | Gold | $9,819,644,540.94 | 2.80% |
| 6 | 3004 | Packaged Medicaments | $8,126,795,819.21 | 2.30% |
| 7 | 8407 | Spark-Ignition Engines | $5,033,975,594.89 | 1.40% |
| 8 | 8525 | Broadcasting Equipment | $5,014,458,643.65 | 1.40% |
| 9 | 8701 | Tractors | $4,070,440,790.57 | 1.20% |
| 10 | 8429 | Large Construction Vehicles | $3,973,839,297.32 | 1.10% |
| 11 | 8708 | Vehicle Parts | $3,923,974,910.20 | 1.10% |
| 12 | 2710 | Refined Petroleum | $3,782,955,457.12 | 1.10% |
| 13 | 4011 | Rubber Tires | $3,534,332,525.47 | 1.00% |
| 14 | 8517 | Telephones | $3,241,676,522.06 | 0.93% |
| 15 | 8481 | Valves | $3,177,561,990.37 | 0.91% |
| 16 | 8716 | Trailers | $2,889,279,672.78 | 0.83% |
| 17 | 8411 | Gas Turbines | $2,705,006,026.63 | 0.77% |
| 18 | 8528 | Video Displays | $2,623,913,739.29 | 0.75% |
| 19 | 8413 | Liquid Pumps | $2,568,652,007.60 | 0.74% |
| 20 | 3002 | Human or Animal Blood | $2,560,965,261.94 | 0.73% |
Who are the top countries of origin for Canada ?
| Sr | Code | Country Name | Value of Exports | Percent of total | |
| 1 | USA | United States | $159,010,407,131.04 | 46% | |
| 2 | CHN | China | $47,738,046,324.39 | 14% | |
| 3 | MEX | Mexico | $18,959,383,365.43 | 5.40% | |
| 4 | JPN | Japan | $14,217,125,539.93 | 4.10% | |
| 5 | DEU | Germany | $13,414,241,927.54 | 3.80% | |
| 6 | GBR | United Kingdom | $8,020,154,552.58 | 2.30% | |
| 7 | KOR | South Korea | $6,147,866,456.18 | 1.80% | |
| 8 | DZA | Algeria | $5,171,499,211.36 | 1.50% | |
| 9 | ITA | Italy | $4,806,365,839.80 | 1.40% | |
| 10 | FRA | France | $4,351,406,937.73 | 1.20% | |
| 11 | CHE | Switzerland | $3,592,079,437.42 | 1.00% | |
| 12 | BRA | Brazil | $3,564,708,031.33 | 1.00% | |
| 13 | PER | Peru | $3,560,812,626.84 | 1.00% | |
| 14 | NLD | Netherlands | $3,276,195,390.08 | 0.94% | |
| 15 | KAZ | Kazakhstan | $3,080,116,648.96 | 0.88% | |
| 16 | NOR | Norway | $2,989,893,693.43 | 0.86% | |
| 17 |
|
India | $2,513,412,402.43 | 0.72% | |
| 18 | Other Asia | $2,394,804,814.30 | 0.69% | ||
| 19 | ARG | Argentina | $2,218,944,255.38 | 0.64% | |
| 20 | AUS | Australia | $2,172,145,609.40 | 0.62% |
Statistics sourced from The Observatory of Economic Complexity.
Canada continues to strengthen its local production capabilities, and diversify its export markets.
Are you looking to source products from Canada ? Need guidance and linkages to export sources. Click here to send your questions.
![]()