


Malaysia – Imports
 Imports of Malaysia
What is the composition of Malaysia’s imports?
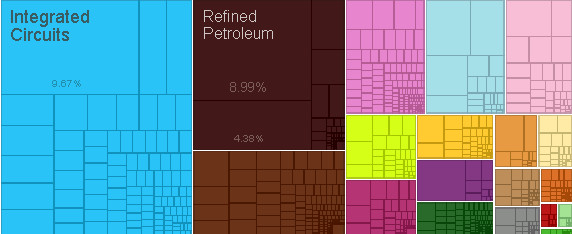
What are the top imports of Malaysia ?
| Sr | HS | Description | Value of Exports | Percent of total |
| 1 | 8542 | Integrated Circuits | $17,919,997,929.12 | 9.70% |
| 2 | 2710 | Refined Petroleum | $16,663,456,652.01 | 9.00% |
| 3 | 2709 | Crude Petroleum | $8,108,882,746.23 | 4.40% |
| 4 | 8473 | Office Machine Parts | $3,622,344,056.66 | 2.00% |
| 5 | 8802 | Planes, Helicopters, and/or Spacecraft | $3,432,239,138.97 | 1.90% |
| 6 | 8471 | Computers | $3,238,534,977.30 | 1.70% |
| 7 | 7108 | Gold | $2,799,635,764.88 | 1.50% |
| 8 | 8703 | Cars | $2,739,145,272.29 | 1.50% |
| 9 | 8708 | Vehicle Parts | $2,397,066,830.95 | 1.30% |
| 10 | 8525 | Broadcasting Equipment | $2,317,494,254.18 | 1.30% |
| 11 | 4001 | Rubber | $2,276,220,794.00 | 1.20% |
| 12 | 8517 | Telephones | $2,240,905,560.09 | 1.20% |
| 13 | 2701 | Coal Briquettes | $2,235,773,840.82 | 1.20% |
| 14 | 8541 | Semiconductor Devices | $2,058,351,731.60 | 1.10% |
| 15 | 8529 | Broadcasting Accessories | $1,926,560,233.07 | 1.00% |
| 16 | 7403 | Refined Copper | $1,778,389,972.84 | 0.96% |
| 17 | 8534 | Printed Circuit Boards | $1,769,065,881.65 | 0.95% |
| 18 | 8479 | Machinery Having Individual Functions | $1,691,013,161.16 | 0.91% |
| 19 | 1511 | Palm Oil | $1,615,717,251.11 | 0.87% |
| 20 | 2713 | Petroleum Coke | $1,581,267,585.79 | 0.85% |
Who are the top countries of origin for Malaysia ?
| Sr | Code | Country Name | Value of Imports | Percent of total |
| 1 | CHN | China | $29,737,819,924.33 | 16% |
| 2 | SGP | Singapore | $26,329,801,343.57 | 14% |
| 3 | JPN | Japan | $17,229,448,826.09 | 9.30% |
| 4 | IDN | Indonesia | $11,338,747,425.71 | 6.10% |
| 5 | THA | Thailand | $10,962,593,054.39 | 5.90% |
| 6 | USA | United States | $10,674,981,134.83 | 5.80% |
| 7 | KOR | South Korea | $7,718,473,724.74 | 4.20% |
| 8 | Other Asia | $7,499,090,327.30 | 4.00% | |
| 9 | DEU | Germany | $6,689,020,275.91 | 3.60% |
| 10 | AUS | Australia | $4,989,075,996.87 | 2.70% |
| 11 | HKG | Hong Kong | $4,261,276,217.29 | 2.30% |
| 12 | FRA | France | $4,073,735,616.02 | 2.20% |
| 13 | VNM | Vietnam | $3,996,363,544.69 | 2.20% |
| 14 | IND | India | $3,765,589,334.86 | 2.00% |
| 15 | ARE | United Arab Emirates | $3,746,486,735.72 | 2.00% |
| 16 | GBR | United Kingdom | $2,321,017,843.12 | 1.30% |
| 17 | SAU | Saudi Arabia | $2,169,156,279.99 | 1.20% |
| 18 | BRA | Brazil | $2,001,195,097.81 | 1.10% |
| 19 | PHL | Philippines | $1,698,719,316.36 | 0.92% |
| 20 | ITA | Italy | $1,616,526,740.90 | 0.87% |
Statistics sourced from The Observatory of Economic Complexity.
Malaysia continues to strengthen its local production capabilities, and diversify its export markets.
Are you looking to source products from Malaysia ? Need guidance and linkages to export sources. Click here to send your questions.
![]()