


Japan – Imports
 Imports of Japan
What is the composition of Japan ‘s imports?
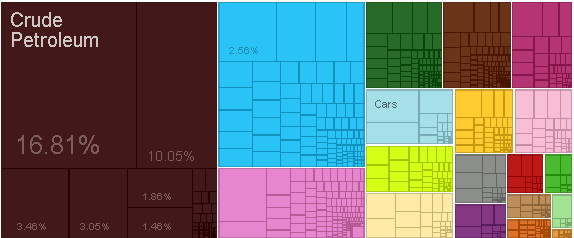
What are the top imports of Japan ?
| Sr | HS | Description | Value of Exports | Percent of total |
| 1 | 2709 | Crude Petroleum | $133,368,096,134.23 | 17% |
| 2 | 2711 | Petroleum Gas | $79,747,304,406.45 | 10% |
| 3 | 2710 | Refined Petroleum | $27,466,567,150.96 | 3.50% |
| 4 | 2701 | Coal Briquettes | $24,207,511,064.98 | 3.10% |
| 5 | 8471 | Computers | $20,312,786,003.26 | 2.60% |
| 6 | 3004 | Packaged Medicaments | $15,482,818,969.04 | 2.00% |
| 7 | 2601 | Iron Ore | $14,796,461,842.95 | 1.90% |
| 8 | 8525 | Broadcasting Equipment | $13,640,826,117.55 | 1.70% |
| 9 | 2603 | Copper Ore | $11,559,605,334.66 | 1.50% |
| 10 | 8517 | Telephones | $11,085,030,607.85 | 1.40% |
| 11 | 8703 | Cars | $10,747,196,276.82 | 1.40% |
| 12 | 8708 | Vehicle Parts | $6,963,668,440.14 | 0.88% |
| 13 | 8544 | Insulated Wire | $6,546,214,199.19 | 0.83% |
| 14 | 9018 | Medical Instruments | $6,287,771,921.84 | 0.79% |
| 15 | 7601 | Raw Aluminium | $5,693,509,742.47 | 0.72% |
| 16 | 8542 | Integrated Circuits | $5,362,249,095.90 | 0.68% |
| 17 | 6110 | Knit Sweaters | $5,019,339,006.13 | 0.63% |
| 18 | 8802 | Planes, Helicopters, and/or Spacecraft | $5,007,918,724.42 | 0.63% |
| 19 | 203 | Pig Meat | $4,721,196,298.09 | 0.60% |
| 20 | 3002 | Human or Animal Blood | $4,583,424,582.21 | 0.58% |
Who are the top countries of origin for Japan ?
| Sr | Code | Country Name | Value of Imports | Percent of total |
| 1 | CHN | China | $174,964,445,479.93 | 22% |
| 2 | USA | United States | $67,053,083,641.72 | 8.50% |
| 3 | AUS | Australia | $48,950,655,904.92 | 6.20% |
| 4 | SAU | Saudi Arabia | $47,533,622,563.67 | 6.00% |
| 5 | KOR | South Korea | $38,955,472,456.25 | 4.90% |
| 6 | ARE | United Arab Emirates | $38,384,745,986.23 | 4.80% |
| 7 | IDN | Indonesia | $32,164,785,987.66 | 4.10% |
| 8 | QAT | Qatar | $31,513,847,498.86 | 4.00% |
| 9 | MYS | Malaysia | $29,601,418,126.24 | 3.70% |
| 10 | DEU | Germany | $22,961,872,107.64 | 2.90% |
| 11 | THA | Thailand | $22,542,214,436.45 | 2.80% |
| 12 | RUS | Russia | $17,355,990,724.55 | 2.20% |
| 13 | Other Asia | $14,727,414,781.21 | 1.90% | |
| 14 | VNM | Vietnam | $14,045,993,064.14 | 1.80% |
| 15 | KWT | Kuwait | $13,342,405,858.23 | 1.70% |
| 16 | FRA | France | $11,314,152,261.23 | 1.40% |
| 17 | CAN | Canada | $10,117,497,001.05 | 1.30% |
| 18 | PHL | Philippines | $9,469,580,239.68 | 1.20% |
| 19 | BRA | Brazil | $8,779,535,940.75 | 1.10% |
| 20 | CHL | Chile | $8,546,580,317.49 | 1.10% |
Statistics sourced from The Observatory of Economic Complexity.
Japan continues to strengthen its local production capabilities, and diversify its export markets.
Are you looking to source products from Japan ? Need guidance and linkages to export sources. Click here to send your questions.
![]()