


Vietnam – Imports
 Imports of Vietnam
What is the composition of Vietnam’s imports?
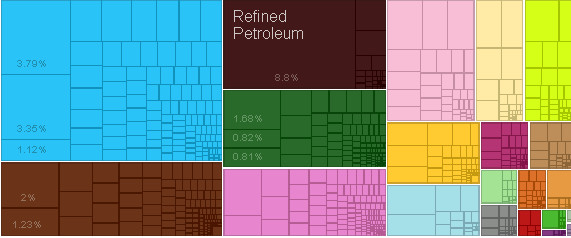
What are the top imports of Vietnam ?
| Sr | HS | Description | Value of Exports | Percent of total |
| 1 | 2710 | Refined Petroleum | $8,859,970,725.70 | 8.80% |
| 2 | 8517 | Telephones | $3,814,261,347.50 | 3.80% |
| 3 | 8542 | Integrated Circuits | $3,371,509,632.27 | 3.30% |
| 4 | 7208 | Hot-Rolled Iron | $2,017,879,833.30 | 2.00% |
| 5 | 6002 | Light Rubberized Knitted Fabric | $1,691,671,965.80 | 1.70% |
| 6 | 3004 | Packaged Medicaments | $1,354,132,029.16 | 1.30% |
| 7 | 3901 | Ethylene Polymers | $1,331,562,841.87 | 1.30% |
| 8 | 7204 | Scrap Iron | $1,239,635,706.12 | 1.20% |
| 9 | 8471 | Computers | $1,124,562,224.03 | 1.10% |
| 10 | 2304 | Soybean Meal | $1,096,663,078.86 | 1.10% |
| 11 | 8802 | Planes, Helicopters, and/or Spacecraft | $1,073,443,266.36 | 1.10% |
| 12 | 202 | Frozen Bovine Meat | $975,666,204.83 | 0.97% |
| 13 | 8479 | Machinery Having Individual Functions | $967,333,490.34 | 0.96% |
| 14 | 3902 | Propylene Polymers | $958,634,286.39 | 0.95% |
| 15 | 8534 | Printed Circuit Boards | $953,247,489.99 | 0.95% |
| 16 | 3907 | Polyacetals | $947,771,045.84 | 0.94% |
| 17 | 5407 | Synthetic Filament Yarn Woven Fabric | $824,102,444.66 | 0.82% |
| 18 | 8708 | Vehicle Parts | $813,848,856.30 | 0.81% |
| 19 | 5201 | Raw Cotton | $810,792,748.63 | 0.81% |
| 20 | 303 | Non-fillet Frozen Fish | $809,714,247.75 | 0.80% |
Who are the top countries of origin for Vietnam ?
| Sr | Code | Country Name | Value of Imports | Percent of total |
| 1 | CHN | China | $28,567,056,225.62 | 28% |
| 2 | KOR | South Korea | $15,216,963,546.43 | 15% |
| 3 | JPN | Japan | $9,591,933,804.15 | 9.50% |
| 4 | SGP | Singapore | $5,905,263,119.08 | 5.90% |
| 5 | THA | Thailand | $5,377,157,643.71 | 5.30% |
| 6 | MYS | Malaysia | $3,394,855,679.96 | 3.40% |
| 7 | HKG | Hong Kong | $3,332,263,795.12 | 3.30% |
| 8 | IND | India | $3,303,036,817.43 | 3.30% |
| 9 | USA | United States | $2,967,170,934.23 | 2.90% |
| 10 | Other Asia | $2,624,449,478.63 | 2.60% | |
| 11 | DEU | Germany | $2,459,446,891.39 | 2.40% |
| 12 | IDN | Indonesia | $2,317,274,214.38 | 2.30% |
| 13 | AUS | Australia | $1,350,668,582.12 | 1.30% |
| 14 | PHL | Philippines | $894,930,148.66 | 0.89% |
| 15 | BRA | Brazil | $827,732,620.27 | 0.82% |
| 16 | FRA | France | $787,540,348.25 | 0.78% |
| 17 | SAU | Saudi Arabia | $783,566,573.47 | 0.78% |
| 18 | RUS | Russia | $732,477,789.77 | 0.73% |
| 19 | ARG | Argentina | $730,246,108.02 | 0.73% |
| 20 | NLD | Netherlands | $684,658,962.56 | 0.68% |
Statistics sourced from The Observatory of Economic Complexity.
Vietnam continues to strengthen its local production capabilities, and diversify its export markets.
Are you looking to source products from Vietnam ? Need guidance and linkages to export sources. Click here to send your questions.
![]()