UAE – Exports
What is the composition of UAE exports ?
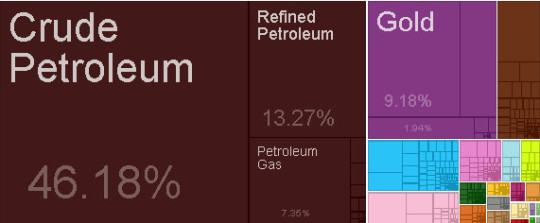
What are the top exports of UAE ?
| Sr | HS | Description | Value of Exports | Percent of total |
| 1 | 2709 | Crude Petroleum | $74,195,291,948.55 | 46% |
| 2 | 2710 | Refined Petroleum | $21,319,557,169.96 | 13% |
| 3 | 7108 | Gold | $14,745,898,336.00 | 9.20% |
| 4 | 2711 | Petroleum Gas | $11,817,378,523.18 | 7.40% |
| 5 | 7113 | Jewellery | $5,599,595,918.00 | 3.50% |
| 6 | 7601 | Raw Aluminium | $3,530,799,157.71 | 2.20% |
| 7 | 7102 | Diamonds | $3,122,064,765.00 | 1.90% |
| 8 | 3901 | Ethylene Polymers | $1,648,920,662.67 | 1.00% |
| 9 | 8525 | Broadcasting Equipment | $1,567,688,896.00 | 0.98% |
| 10 | 8411 | Gas Turbines | $857,745,198.00 | 0.53% |
| 11 | 3902 | Propylene Polymers | $828,774,629.46 | 0.52% |
| 12 | 7404 | Scrap Copper | $593,288,469.32 | 0.37% |
| 13 | 7204 | Scrap Iron | $570,032,338.65 | 0.35% |
| 14 | 2707 | Coal Tar Oil | $526,286,514.35 | 0.33% |
| 15 | 2503 | Sulphur | $448,709,272.28 | 0.28% |
| 16 | 8703 | Cars | $436,279,959.00 | 0.27% |
| 17 | 2901 | Acyclic Hydrocarbons | $404,036,623.07 | 0.25% |
| 18 | 3920 | Raw Plastic Sheeting | $396,491,918.38 | 0.25% |
| 19 | 3907 | Polyacetals | $338,349,267.23 | 0.21% |
| 20 | 7308 | Iron Structures | $321,711,796.47 | 0.20% |
What are the top markets for UAE ?
| Sr | Code | Country Name | Value of Exports | Percent of total |
| 1 | JPN | Japan | $38,384,745,986.23 | 24% |
| 2 | IND | India | $33,460,219,897.61 | 21% |
| 3 | SGP | Singapore | $13,567,787,630.85 | 8.40% |
| 4 | KOR | South Korea | $13,356,548,219.83 | 8.30% |
| 5 | CHN | China | $9,546,857,095.93 | 5.90% |
| 6 | PAK | Pakistan | $6,580,195,236.15 | 4.10% |
| 7 | OMN | Oman | $6,308,191,526.41 | 3.90% |
| 8 | MYS | Malaysia | $3,746,486,735.72 | 2.30% |
| 9 | TUR | Turkey | $3,587,265,319.79 | 2.20% |
| 10 | HKG | Hong Kong | $3,345,928,107.18 | 2.10% |
| 11 | AUS | Australia | $2,739,184,479.13 | 1.70% |
| 12 | PHL | Philippines | $1,728,692,774.28 | 1.10% |
| 13 | GBR | United Kingdom | $1,610,877,038.70 | 1.00% |
| 14 | IDN | Indonesia | $1,576,210,315.91 | 0.98% |
| 15 | FRA | France | $1,356,925,396.36 | 0.84% |
| 16 | LKA | Sri Lanka | $1,191,929,219.40 | 0.74% |
| 17 | ZAF | South Africa | $1,104,146,951.60 | 0.69% |
| 18 | USA | United States | $1,053,347,367.36 | 0.66% |
| 19 | YEM | Yemen | $1,034,337,422.94 | 0.64% |
| 20 | NLD | Netherlands | $1,026,764,883.72 | 0.64% |
Statistics sourced from The Observatory of Economic Complexity.
UAE continues to strengthen its local production capabilities, and diversify its export markets.
Are you looking to source products from UAE ? Need guidance and linkages to export sources. Click here to send your questions.
![]()