


South Africa – Imports
 Imports of South Africa
What is the composition of South Africa’s imports?
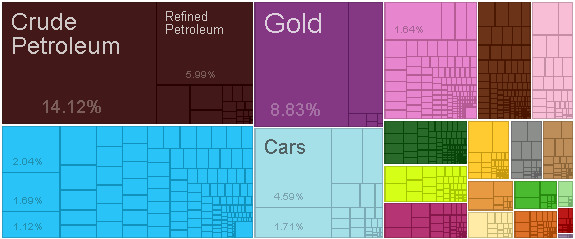
What are the top imports of South Africa ?
| Sr | HS | Description | Value of Exports | Percent of total |
| 1 | 2709 | Crude Petroleum | $16,457,242,718.76 | 14% |
| 2 | 7108 | Gold | $10,285,954,066.72 | 8.80% |
| 3 | 2710 | Refined Petroleum | $6,978,769,358.99 | 6.00% |
| 4 | 8703 | Cars | $5,350,207,971.42 | 4.60% |
| 5 | 7102 | Diamonds | $3,351,760,401.26 | 2.90% |
| 6 | 8471 | Computers | $2,378,524,879.94 | 2.00% |
| 7 | 8704 | Delivery Trucks | $1,993,588,389.43 | 1.70% |
| 8 | 8525 | Broadcasting Equipment | $1,965,817,767.25 | 1.70% |
| 9 | 3004 | Packaged Medicaments | $1,916,041,066.15 | 1.60% |
| 10 | 8708 | Vehicle Parts | $1,546,270,156.06 | 1.30% |
| 11 | 8429 | Large Construction Vehicles | $1,306,081,556.67 | 1.10% |
| 12 | 8517 | Telephones | $1,221,798,466.05 | 1.00% |
| 13 | 2711 | Petroleum Gas | $1,171,821,864.42 | 1.00% |
| 14 | 8802 | Planes, Helicopters, and/or Spacecraft | $977,275,355.92 | 0.84% |
| 15 | 8431 | Excavation Machinery | $787,470,080.27 | 0.68% |
| 16 | 4011 | Rubber Tires | $765,008,974.65 | 0.66% |
| 17 | 2603 | Copper Ore | $733,257,097.95 | 0.63% |
| 18 | 1006 | Rice | $696,092,010.48 | 0.60% |
| 19 | 8443 | Industrial Printers | $648,969,870.24 | 0.56% |
| 20 | 8701 | Tractors | $618,792,139.66 | 0.53% |
Who are the top countries of origin for South Africa ?
| Sr | Code | Country Name | Value of Imports | Percent of total |
| 1 | CHN | China | $15,205,879,507.01 | 13% |
| 2 | DEU | Germany | $8,618,288,446.73 | 7.40% |
| 3 | USA | United States | $8,069,778,789.14 | 6.90% |
| 4 | SAU | Saudi Arabia | $7,855,436,910.61 | 6.70% |
| 5 | GBR | United Kingdom | $6,385,483,234.97 | 5.50% |
| 6 | NGA | Nigeria | $6,217,062,028.75 | 5.30% |
| 7 | IND | India | $4,820,661,766.22 | 4.10% |
| 8 | GHA | Ghana | $4,446,174,246.55 | 3.80% |
| 9 | JPN | Japan | $3,371,632,271.40 | 2.90% |
| 10 | AGO | Angola | $2,777,159,143.31 | 2.40% |
| 11 | ITA | Italy | $2,632,027,074.03 | 2.30% |
| 12 | FRA | France | $2,497,098,766.76 | 2.10% |
| 13 | KOR | South Korea | $2,338,423,798.23 | 2.00% |
| 14 | THA | Thailand | $2,042,117,367.95 | 1.80% |
| 15 | NLD | Netherlands | $2,010,475,367.52 | 1.70% |
| 16 | IDN | Indonesia | $1,669,985,437.20 | 1.40% |
| 17 | BRA | Brazil | $1,634,787,128.86 | 1.40% |
| 18 | BLX | Belgium-Luxembourg | $1,630,397,148.30 | 1.40% |
| 19 | AUS | Australia | $1,500,693,912.86 | 1.30% |
| 20 | ZWE | Zimbabwe | $1,446,874,966.19 | 1.20% |
Statistics sourced from The Observatory of Economic Complexity.
South Africa continues to strengthen its local production capabilities, and diversify its export markets.
Are you looking to source products from South Africa ? Need guidance and linkages to export sources. Click here to send your questions.
![]()