


Argentina – Imports
 Imports of Argentina
What is the composition of Argentina’s imports?
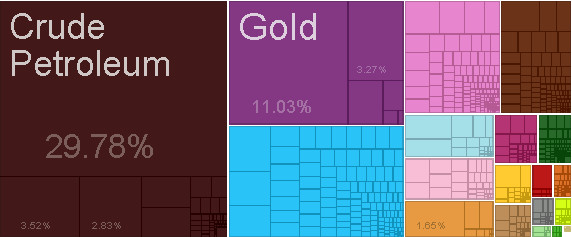
What are the top imports of Argentina ?
| Sr | HS | Description | Value of Exports | Percent of total |
| 1 | 2304 | Soybean Meal | $10,559,613,074.28 | 13% |
| 2 | 1005 | Corn | $4,846,413,662.58 | 6.10% |
| 3 | 1507 | Soybean Oil | $4,345,644,976.70 | 5.40% |
| 4 | 8703 | Cars | $4,015,316,336.69 | 5.00% |
| 5 | 8704 | Delivery Trucks | $3,949,142,769.61 | 4.90% |
| 6 | 1201 | Soybeans | $3,234,361,424.79 | 4.00% |
| 7 | 1001 | Wheat | $3,146,820,259.82 | 3.90% |
| 8 | 2709 | Crude Petroleum | $2,641,481,388.16 | 3.30% |
| 9 | 7108 | Gold | $2,244,189,488.40 | 2.80% |
| 10 | 3823 | Industrial Fatty Acids, Oils and Alcohols | $1,909,053,829.31 | 2.40% |
| 11 | 2603 | Copper Ore | $1,585,765,002.07 | 2.00% |
| 12 | 8708 | Vehicle Parts | $1,371,555,086.13 | 1.70% |
| 13 | 2710 | Refined Petroleum | $1,366,974,679.35 | 1.70% |
| 14 | 7304 | Iron Pipes | $1,098,826,456.93 | 1.40% |
| 15 | 1512 | Seed Oils | $958,177,019.73 | 1.20% |
| 16 | 2204 | Wine | $947,039,378.88 | 1.20% |
| 17 | 8802 | Planes, Helicopters, and/or Spacecraft | $868,844,613.57 | 1.10% |
| 18 | 1003 | Barley | $861,403,632.95 | 1.10% |
| 19 | 402 | Concentrated Milk | $835,640,999.51 | 1.00% |
| 20 | 2711 | Petroleum Gas | $797,730,106.13 | 1.00% |
Who are the top countries of origin for Argentina ?
| Sr | Code | Country Name | Value of Exports | Percent of total |
| 1 | BRA | Brazil | $16,500,479,508.25 | 21% |
| 2 | CHN | China | $5,008,334,005.53 | 6.30% |
| 3 | CHL | Chile | $4,454,172,999.50 | 5.60% |
| 4 | USA | United States | $4,279,040,516.91 | 5.40% |
| 5 | ESP | Spain | $2,672,944,574.74 | 3.30% |
| 6 | VEN | Venezuela | $2,225,302,944.00 | 2.80% |
| 7 | CAN | Canada | $2,218,944,255.38 | 2.80% |
| 8 | NLD | Netherlands | $2,192,481,159.68 | 2.70% |
| 9 | DEU | Germany | $2,100,893,292.11 | 2.60% |
| 10 | COL | Colombia | $2,096,289,105.11 | 2.60% |
| 11 | PER | Peru | $1,977,197,006.39 | 2.50% |
| 12 | URY | Uruguay | $1,786,517,293.88 | 2.20% |
| 13 | IDN | Indonesia | $1,637,942,946.02 | 2.10% |
| 14 | DZA | Algeria | $1,532,786,674.08 | 1.90% |
| 15 | PRY | Paraguay | $1,508,069,821.59 | 1.90% |
| 16 | KOR | South Korea | $1,377,235,247.94 | 1.70% |
| 17 | ITA | Italy | $1,261,582,999.26 | 1.60% |
| 18 | JPN | Japan | $1,246,425,847.63 | 1.60% |
| 19 | MYS | Malaysia | $1,231,884,674.50 | 1.50% |
| 20 | IND | India | $1,224,822,509.69 | 1.50% |
Statistics sourced from The Observatory of Economic Complexity.
Argentina continues to strengthen its local production capabilities, and diversify its export markets.
Are you looking to source products from Argentina ? Need guidance and linkages to export sources. Click here to send your questions.
![]()