


Singapore – Imports
 Imports of Singapore
What is the composition of Singapore’s imports?
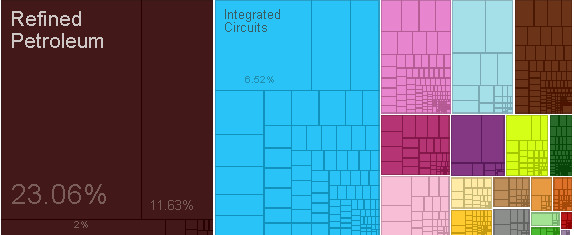
What are the top imports of Singapore ?
| Sr | HS | Description | Value of Exports | Percent of total |
| 1 | 2710 | Refined Petroleum | $70,511,134,025.84 | 23% |
| 2 | 2709 | Crude Petroleum | $35,552,947,905.10 | 12% |
| 3 | 8542 | Integrated Circuits | $19,947,148,070.75 | 6.50% |
| 4 | 8471 | Computers | $8,128,440,087.49 | 2.70% |
| 5 | 2711 | Petroleum Gas | $6,116,846,194.61 | 2.00% |
| 6 | 8525 | Broadcasting Equipment | $5,808,723,042.86 | 1.90% |
| 7 | 8473 | Office Machine Parts | $4,960,437,574.34 | 1.60% |
| 8 | 8803 | Aircraft Parts | $4,143,229,645.35 | 1.40% |
| 9 | 8517 | Telephones | $3,644,572,044.15 | 1.20% |
| 10 | 7113 | Jewellery | $3,443,994,264.12 | 1.10% |
| 11 | 8901 | Passenger and Cargo Ships | $3,420,950,128.32 | 1.10% |
| 12 | 8411 | Gas Turbines | $3,081,521,045.87 | 1.00% |
| 13 | 7108 | Gold | $2,742,949,663.22 | 0.90% |
| 14 | 8479 | Machinery Having Individual Functions | $2,361,243,263.50 | 0.77% |
| 15 | 8541 | Semiconductor Devices | $2,360,565,846.98 | 0.77% |
| 16 | 8443 | Industrial Printers | $2,210,725,843.87 | 0.72% |
| 17 | 8905 | Special Purpose Ships | $2,191,289,453.89 | 0.72% |
| 18 | 8431 | Excavation Machinery | $2,178,312,352.71 | 0.71% |
| 19 | 8536 | Low-voltage Protection Equipment | $2,074,989,779.60 | 0.68% |
| 20 | 3901 | Ethylene Polymers | $2,045,687,406.11 | 0.67% |
Who are the top countries of origin for Singapore ?
| Sr | Code | Country Name | Value of Imports | Percent of total |
| 1 | CHN | China | $37,130,789,064.89 | 12% |
| 2 | MYS | Malaysia | $31,003,655,290.04 | 10% |
| 3 | KOR | South Korea | $25,596,214,995.00 | 8.40% |
| 4 | USA | United States | $21,754,320,521.56 | 7.10% |
| 5 | JPN | Japan | $19,346,680,914.05 | 6.30% |
| 6 | IDN | Indonesia | $19,270,764,878.00 | 6.30% |
| 7 | SAU | Saudi Arabia | $15,324,619,895.00 | 5.00% |
| 8 | ARE | United Arab Emirates | $13,567,787,630.85 | 4.40% |
| 9 | IND | India | $12,343,587,100.73 | 4.00% |
| 10 | DEU | Germany | $8,922,977,814.62 | 2.90% |
| 11 | THA | Thailand | $8,625,569,718.03 | 2.80% |
| 12 | Other Asia | $6,928,689,656.27 | 2.30% | |
| 13 | QAT | Qatar | $6,710,324,252.31 | 2.20% |
| 14 | NLD | Netherlands | $6,591,478,539.78 | 2.20% |
| 15 | FRA | France | $6,546,214,501.79 | 2.10% |
| 16 | GBR | United Kingdom | $6,290,785,841.97 | 2.10% |
| 17 | AUS | Australia | $5,014,752,527.73 | 1.60% |
| 18 | CHE | Switzerland | $4,424,281,562.16 | 1.40% |
| 19 | KWT | Kuwait | $4,215,318,411.26 | 1.40% |
| 20 | PHL | Philippines | $3,877,353,625.40 | 1.30% |
Statistics sourced from The Observatory of Economic Complexity.
Singapore continues to strengthen its local production capabilities, and diversify its export markets.
Are you looking to source products from Singapore ? Need guidance and linkages to export sources. Click here to send your questions.
![]()