


Germany – Imports
 Imports of Germany
What is the composition of Germany’s imports?
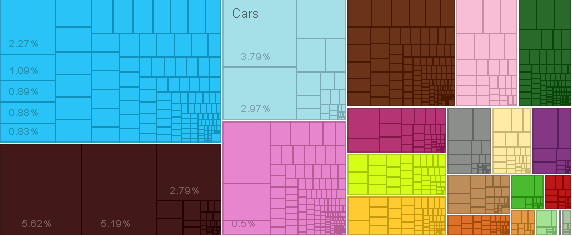
What are the top imports of Germany ?
| Sr | HS | Description | Value of Exports | Percent of total |
| 1 | 2709 | Crude Petroleum | $61,440,108,772.74 | 5.60% |
| 2 | 2711 | Petroleum Gas | $56,818,937,259.75 | 5.20% |
| 3 | 8703 | Cars | $41,480,099,144.10 | 3.80% |
| 4 | 8708 | Vehicle Parts | $32,445,632,075.08 | 3.00% |
| 5 | 2710 | Refined Petroleum | $30,543,047,772.92 | 2.80% |
| 6 | 8471 | Computers | $24,882,324,021.48 | 2.30% |
| 7 | 3004 | Packaged Medicaments | $24,553,827,841.84 | 2.20% |
| 8 | 8802 | Planes, Helicopters, and/or Spacecraft | $16,025,303,019.15 | 1.50% |
| 9 | 3002 | Human or Animal Blood | $15,074,551,657.76 | 1.40% |
| 10 | 8542 | Integrated Circuits | $11,885,830,628.51 | 1.10% |
| 11 | 8544 | Insulated Wire | $9,763,661,822.60 | 0.89% |
| 12 | 8525 | Broadcasting Equipment | $9,648,932,872.58 | 0.88% |
| 13 | 8541 | Semiconductor Devices | $9,047,266,659.33 | 0.83% |
| 14 | 7108 | Gold | $8,584,615,930.71 | 0.78% |
| 15 | 8803 | Aircraft Parts | $8,298,614,520.31 | 0.76% |
| 16 | 8411 | Gas Turbines | $8,161,781,794.32 | 0.75% |
| 17 | 9018 | Medical Instruments | $8,070,983,768.57 | 0.74% |
| 18 | 4011 | Rubber Tires | $7,657,626,024.79 | 0.70% |
| 19 | 8517 | Telephones | $7,582,296,847.78 | 0.69% |
| 20 | 9401 | Seats | $7,183,928,742.65 | 0.66% |
Who are the top countries of origin for Germany ?
| Sr | Code | Country Name | Value of Imports | Percent of total |
| 1 | NLD | Netherlands | $97,675,127,085.18 | 8.90% |
| 2 | CHN | China | $93,922,172,605.41 | 8.60% |
| 3 | FRA | France | $78,751,593,505.07 | 7.20% |
| 4 | USA | United States | $59,915,587,446.37 | 5.50% |
| 5 | ITA | Italy | $56,911,268,662.39 | 5.20% |
| 6 | BLX | Belgium-Luxembourg | $54,174,672,701.14 | 5.00% |
| 7 | GBR | United Kingdom | $47,478,828,163.19 | 4.30% |
| 8 | Special Categories | $47,233,899,254.16 | 4.30% | |
| 9 | CHE | Switzerland | $45,773,068,256.51 | 4.20% |
| 10 | CZE | Czech Republic | $42,643,336,553.54 | 3.90% |
| 11 | AUT | Austria | $41,962,735,705.16 | 3.80% |
| 12 | POL | Poland | $40,319,669,031.24 | 3.70% |
| 13 | RUS | Russia | $30,521,090,747.41 | 2.80% |
| 14 | ESP | Spain | $27,348,637,728.95 | 2.50% |
| 15 | JPN | Japan | $26,507,830,695.77 | 2.40% |
| 16 | HUN | Hungary | $23,099,306,781.32 | 2.10% |
| 17 | NOR | Norway | $20,776,373,688.23 | 1.90% |
| 18 | SWE | Sweden | $16,244,174,077.22 | 1.50% |
| 19 | SVK | Slovakia | $15,878,994,634.70 | 1.50% |
| 20 | TUR | Turkey | $14,774,640,388.56 | 1.40% |
Statistics sourced from The Observatory of Economic Complexity.
Germany continues to strengthen its local production capabilities, and diversify its export markets.
Are you looking to source products from Germany ? Need guidance and linkages to export sources. Click here to send your questions.
![]()