Saudi Arabia – Exports
What is the composition of Saudi Arabia exports ?
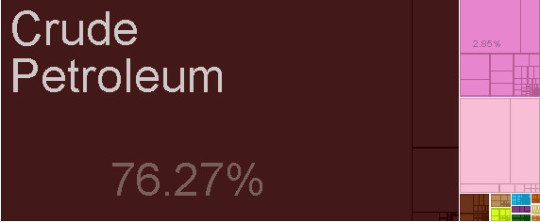
What are the top exports of Saudi Arabia ?
| Sr | HS | Description | Value of Exports | Percent of total |
| 1 | 2709 | Crude Petroleum | $198,498,719,269.50 | 76% |
| 2 | 2710 | Refined Petroleum | $14,957,149,039.25 | 5.70% |
| 3 | 3901 | Ethylene Polymers | $9,516,220,361.32 | 3.70% |
| 4 | 2905 | Acyclic Alcohols | $7,424,738,104.52 | 2.90% |
| 5 | 2711 | Petroleum Gas | $6,534,609,918.85 | 2.50% |
| 6 | 3902 | Propylene Polymers | $5,743,414,317.20 | 2.20% |
| 7 | 2902 | Cyclic Hydrocarbons | $2,302,695,211.36 | 0.88% |
| 8 | 2909 | Ethers | $1,753,210,345.12 | 0.67% |
| 9 | 3102 | Nitrogenous Fertilizers | $1,076,249,006.10 | 0.41% |
| 10 | 2901 | Acyclic Hydrocarbons | $960,434,570.85 | 0.37% |
| 11 | 3907 | Polyacetals | $716,133,406.04 | 0.28% |
| 12 | 2814 | Ammonia | $650,983,497.01 | 0.25% |
| 13 | 3105 | Mixed Mineral or Chemical Fertilizers | $637,302,414.25 | 0.24% |
| 14 | 7404 | Scrap Copper | $612,989,432.01 | 0.24% |
| 15 | 2503 | Sulphur | $495,821,913.06 | 0.19% |
| 16 | 2915 | Saturated Acyclic Monocarboxylic Acids | $455,573,496.91 | 0.18% |
| 17 | 2910 | Epoxides | $340,105,886.37 | 0.13% |
| 18 | 3920 | Raw Plastic Sheeting | $293,722,392.87 | 0.11% |
| 19 | 7602 | Scrap Aluminium | $283,138,061.68 | 0.11% |
| 20 | 3817 | Alkylbenzenes and Alkylnaphthalenes | $210,835,383.89 | 0.08% |
What are the top markets for Saudi Arabia ?
| Sr | Code | Country Name | Value of Exports | Percent of total |
| 1 | CHN | China | $48,230,538,400.16 | 19% |
| 2 | JPN | Japan | $47,533,622,563.67 | 18% |
| 3 | KOR | South Korea | $34,560,763,701.49 | 13% |
| 4 | IND | India | $29,151,085,721.09 | 11% |
| 5 | SGP | Singapore | $15,324,619,895.00 | 5.90% |
| 6 | ITA | Italy | $8,512,559,864.62 | 3.30% |
| 7 | ZAF | South Africa | $7,855,436,910.61 | 3.00% |
| 8 | ESP | Spain | $6,891,557,311.61 | 2.60% |
| 9 | FRA | France | $6,249,744,100.80 | 2.40% |
| 10 | NLD | Netherlands | $5,351,296,533.06 | 2.10% |
| 11 | IDN | Indonesia | $4,589,877,112.29 | 1.80% |
| 12 | JOR | Jordan | $4,480,452,879.26 | 1.70% |
| 13 | PAK | Pakistan | $3,651,986,440.34 | 1.40% |
| 14 | GRC | Greece | $3,059,817,062.03 | 1.20% |
| 15 | PHL | Philippines | $3,021,352,974.44 | 1.20% |
| 16 | BRA | Brazil | $2,760,012,482.68 | 1.10% |
| 17 | EGY | Egypt | $2,535,265,792.57 | 0.97% |
| 18 | MAR | Morocco | $2,520,977,381.31 | 0.97% |
| 19 | MYS | Malaysia | $2,169,156,279.99 | 0.83% |
| 20 | TUR | Turkey | $2,059,802,300.44 | 0.79% |
Statistics sourced from The Observatory of Economic Complexity.
Saudi Arabia continues to strengthen its local production capabilities, and diversify its export markets.
Are you looking to source products from Saudi Arabia ? Need guidance and linkages to export sources. Click here to send your questions.
![]()