


Brazil – Imports
 Imports of Brazil
What is the composition of Brazil’s imports?
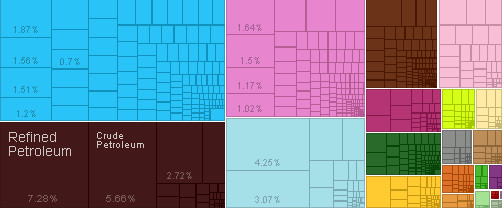
What are the top imports of Brazil ?
| Sr | HS | Description | Value of Exports | Percent of total |
| 1 | 2601 | Iron Ore | $32,738,933,263.29 | 13% |
| 2 | 2709 | Crude Petroleum | $20,694,869,420.72 | 8.40% |
| 3 | 1201 | Soybeans | $17,404,229,338.85 | 7.00% |
| 4 | 1701 | Raw Sugar | $13,176,481,805.36 | 5.30% |
| 5 | 207 | Poultry Meat | $7,031,095,420.08 | 2.80% |
| 6 | 2304 | Soybean Meal | $6,707,239,692.56 | 2.70% |
| 7 | 901 | Coffee | $6,221,145,399.20 | 2.50% |
| 8 | 1005 | Corn | $5,357,176,321.51 | 2.20% |
| 9 | 8802 | Planes, Helicopters, and/or Spacecraft | $5,126,418,316.41 | 2.10% |
| 10 | 2710 | Refined Petroleum | $5,025,095,500.99 | 2.00% |
| 11 | 4703 | Sulfate Chemical Woodpulp | $4,809,376,119.27 | 1.90% |
| 12 | 8703 | Cars | $4,239,042,704.46 | 1.70% |
| 13 | 8708 | Vehicle Parts | $3,816,531,181.84 | 1.50% |
| 14 | 7207 | Semi-Finished Iron | $3,767,604,992.82 | 1.50% |
| 15 | 202 | Frozen Bovine Meat | $3,622,870,989.38 | 1.50% |
| 16 | 2401 | Raw Tobacco | $3,330,935,003.00 | 1.30% |
| 17 | 7108 | Gold | $3,051,775,887.78 | 1.20% |
| 18 | 2009 | Fruit Juice | $2,864,262,831.74 | 1.20% |
| 19 | 7202 | Ferroalloys | $2,615,243,380.07 | 1.10% |
| 20 | 2207 | Alcohol > 80% ABV | $2,351,794,985.82 | 0.95% |
Who are the top countries of origin for Brazil ?
| Sr | Code | Country Name | Value of Exports | Percent of total |
| 1 | CHN | China | $41,303,695,875.49 | 17% |
| 2 | USA | United States | $27,402,098,758.08 | 11% |
| 3 | ARG | Argentina | $17,791,343,136.86 | 7.20% |
| 4 | NLD | Netherlands | $13,358,698,693.98 | 5.40% |
| 5 | DEU | Germany | $9,535,891,124.58 | 3.90% |
| 6 | JPN | Japan | $8,779,535,940.75 | 3.60% |
| 7 | IND | India | $5,682,234,661.63 | 2.30% |
| 8 | VEN | Venezuela | $5,051,784,871.00 | 2.00% |
| 9 | CHL | Chile | $4,874,976,804.21 | 2.00% |
| 10 | KOR | South Korea | $4,829,063,475.51 | 2.00% |
| 11 | GBR | United Kingdom | $4,715,734,692.28 | 1.90% |
| 12 | FRA | France | $4,564,939,014.86 | 1.80% |
| 13 | ITA | Italy | $4,495,505,039.24 | 1.80% |
| 14 | MEX | Mexico | $4,130,212,045.89 | 1.70% |
| 15 | ESP | Spain | $3,867,048,360.92 | 1.60% |
| 16 | BLX | Belgium-Luxembourg | $3,593,059,434.99 | 1.50% |
| 17 | CAN | Canada | $3,564,708,031.33 | 1.40% |
| 18 | RUS | Russia | $3,401,746,171.92 | 1.40% |
| 19 | SAU | Saudi Arabia | $2,986,409,626.00 | 1.20% |
| 20 | SGP | Singapore | $2,983,349,865.47 | 1.20% |
Statistics sourced from The Observatory of Economic Complexity.
Brazil continues to strengthen its local production capabilities, and diversify its export markets.
Are you looking to source products from Brazil ? Need guidance and linkages to export sources. Click here to send your questions.
![]()