Bulgaria – Exports
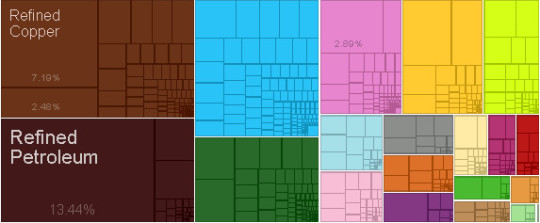
What is the composition of Bulgaria exports ?
What are the top exports of Bulgaria ?
| Sr | HS | Description | Value of Exports | Percent of total |
| 1 | 2709 | Crude Petroleum | $4,762,863,011.95 | 15% |
| 2 | 2603 | Copper Ore | $2,621,310,221.10 | 8.10% |
| 3 | 2710 | Refined Petroleum | $1,430,031,240.67 | 4.40% |
| 4 | 3004 | Packaged Medicaments | $915,678,086.53 | 2.80% |
| 5 | 8541 | Semiconductor Devices | $800,628,260.88 | 2.50% |
| 6 | 8703 | Cars | $610,422,541.26 | 1.90% |
| 7 | 7404 | Scrap Copper | $482,208,580.73 | 1.50% |
| 8 | 8701 | Tractors | $334,899,283.37 | 1.00% |
| 9 | 8802 | Planes, Helicopters, and/or Spacecraft | $306,651,185.19 | 0.94% |
| 10 | 8471 | Computers | $302,335,050.74 | 0.93% |
| 11 | 8544 | Insulated Wire | $283,073,353.66 | 0.87% |
| 12 | 8525 | Broadcasting Equipment | $245,789,384.67 | 0.76% |
| 13 | 2701 | Coal Briquettes | $243,107,681.97 | 0.75% |
| 14 | 203 | Pig Meat | $237,163,767.50 | 0.73% |
| 15 | 6002 | Light Rubberized Knitted Fabric | $220,646,610.06 | 0.68% |
| 16 | 2711 | Petroleum Gas | $217,793,530.81 | 0.67% |
| 17 | 1701 | Raw Sugar | $216,250,415.49 | 0.67% |
| 18 | 7208 | Hot-Rolled Iron | $208,631,097.79 | 0.64% |
| 19 | 8528 | Video Displays | $205,021,576.44 | 0.63% |
| 20 | 8603 | Self-Propelled Rail Transport | $200,932,316.00 | 0.62% |
What are the top markets for Bulgaria ?
| Sr | Code | Country Name | Value of Imports | Percent of total |
| 1 | RUS | Russia | $4,996,186,808.43 | 15% |
| 2 | DEU | Germany | $3,067,122,839.64 | 9.40% |
| 3 | CHN | China | $2,113,110,128.27 | 6.50% |
| 4 | ITA | Italy | $1,997,396,802.02 | 6.20% |
| 5 | ROU | Romania | $1,838,172,285.50 | 5.70% |
| 6 | GRC | Greece | $1,677,851,999.72 | 5.20% |
| 7 | TUR | Turkey | $1,535,107,888.66 | 4.70% |
| 8 | ESP | Spain | $1,457,629,018.08 | 4.50% |
| 9 | FRA | France | $943,777,640.80 | 2.90% |
| 10 | POL | Poland | $746,391,996.23 | 2.30% |
| 11 | HUN | Hungary | $645,230,418.70 | 2.00% |
| 12 | UKR | Ukraine | $635,884,489.47 | 2.00% |
| 13 | AUT | Austria | $619,821,152.39 | 1.90% |
| 14 | AZE | Azerbaijan | $598,573,107.04 | 1.80% |
| 15 | CZE | Czech Republic | $580,442,593.64 | 1.80% |
| 16 | NLD | Netherlands | $571,118,834.90 | 1.80% |
| 17 | USA | United States | $515,658,862.24 | 1.60% |
| 18 | BRA | Brazil | $514,901,175.33 | 1.60% |
| 19 | GBR | United Kingdom | $502,720,647.16 | 1.50% |
| 20 | BLX | Belgium-Luxembourg | $455,363,312.83 | 1.40% |
Statistics sourced from The Observatory of Economic Complexity.
Bulgaria continues to strengthen its local production capabilities, and diversify its export markets.
Are you looking to source products from Bulgaria ? Need guidance and linkages to export sources. Click here to send your questions.


