


Malaysia – Exports
What is the composition of Malaysia exports ?
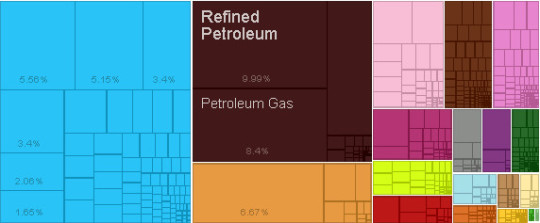
What are the top exports of Malaysia ?
| Sr | HS | Description | Value of Exports | Percent of total |
| 1 | 2710 | Refined Petroleum | $23,924,579,586.76 | 10% |
| 2 | 2711 | Petroleum Gas | $20,115,324,687.37 | 8.40% |
| 3 | 1511 | Palm Oil | $15,983,141,744.48 | 6.70% |
| 4 | 8542 | Integrated Circuits | $13,315,218,425.29 | 5.60% |
| 5 | 8471 | Computers | $12,329,480,256.75 | 5.10% |
| 6 | 2709 | Crude Petroleum | $11,926,018,226.70 | 5.00% |
| 7 | 8473 | Office Machine Parts | $8,152,498,254.92 | 3.40% |
| 8 | 8517 | Telephones | $8,146,330,306.87 | 3.40% |
| 9 | 8541 | Semiconductor Devices | $4,939,238,449.69 | 2.10% |
| 10 | 8528 | Video Displays | $3,956,820,943.13 | 1.70% |
| 11 | 8525 | Broadcasting Equipment | $3,789,955,524.47 | 1.60% |
| 12 | 4015 | Rubber Apparel | $3,495,155,936.73 | 1.50% |
| 13 | 4001 | Rubber | $2,781,030,004.14 | 1.20% |
| 14 | 9030 | Oscilloscopes | $2,771,813,641.58 | 1.20% |
| 15 | 1519 | Stearic Acid | $2,498,269,944.18 | 1.00% |
| 16 | 7113 | Jewellery | $2,384,324,675.42 | 1.00% |
| 17 | 8443 | Industrial Printers | $2,306,600,932.87 | 0.96% |
| 18 | 9403 | Other Furniture | $2,048,632,863.86 | 0.86% |
| 19 | 8527 | Radio Receivers | $1,736,762,025.43 | 0.73% |
| 20 | 8536 | Low-voltage Protection Equipment | $1,720,172,375.34 | 0.72% |
What are the top markets for Malaysia ?
| Sr | Code | Country Name | Value of Exports | Percent of total |
| 1 | SGP | Singapore | $31,003,655,290.04 | 13% |
| 2 | JPN | Japan | $29,601,418,126.24 | 12% |
| 3 | CHN | China | $29,587,285,257.68 | 12% |
| 4 | USA | United States | $17,460,293,845.11 | 7.30% |
| 5 | THA | Thailand | $12,198,097,330.54 | 5.10% |
| 6 | IDN | Indonesia | $11,396,955,607.97 | 4.80% |
| 7 | AUS | Australia | $9,773,939,815.10 | 4.10% |
| 8 | IND | India | $9,500,415,502.59 | 4.00% |
| 9 | KOR | South Korea | $9,391,924,162.70 | 3.90% |
| 10 | NLD | Netherlands | $7,511,561,464.70 | 3.10% |
| 11 | DEU | Germany | $6,687,924,868.33 | 2.80% |
| 12 | Other Asia | $6,405,818,794.00 | 2.70% | |
| 13 | HKG | Hong Kong | $5,908,615,025.36 | 2.50% |
| 14 | ARE | United Arab Emirates | $3,877,935,713.00 | 1.60% |
| 15 | VNM | Vietnam | $3,394,855,679.96 | 1.40% |
| 16 | PHL | Philippines | $2,820,423,895.65 | 1.20% |
| 17 | GBR | United Kingdom | $2,818,481,414.60 | 1.20% |
| 18 | MEX | Mexico | $2,806,730,780.65 | 1.20% |
| 19 | FRA | France | $2,607,239,348.05 | 1.10% |
| 20 | BRA | Brazil | $2,090,813,486.07 | 0.87% |
Statistics sourced from The Observatory of Economic Complexity.
Malaysia continues to strengthen its local production capabilities, and diversify its export markets.
Are you looking to source products from Malaysia ? Need guidance and linkages to export sources. Click here to send your questions.
![]()