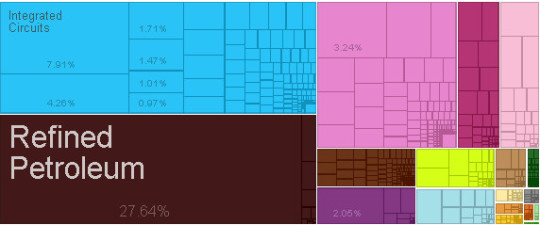
Singapore – Exports
What is the composition of Singapore exports ?
What are the top exports of Singapore ?
| Sr | HS | Description | Value of Exports | Percent of total |
| 1 | 2710 | Refined Petroleum | $62,440,310,807.15 | 28% |
| 2 | 8542 | Integrated Circuits | $17,874,652,329.83 | 7.90% |
| 3 | 8471 | Computers | $9,611,898,007.69 | 4.30% |
| 4 | 2922 | Oxygen Amino Compounds | $7,318,283,108.56 | 3.20% |
| 5 | 3004 | Packaged Medicaments | $4,757,052,008.75 | 2.10% |
| 6 | 7108 | Gold | $4,640,685,180.29 | 2.10% |
| 7 | 8473 | Office Machine Parts | $3,867,022,779.81 | 1.70% |
| 8 | 8517 | Telephones | $3,327,005,300.43 | 1.50% |
| 9 | 2935 | Sulfonamides | $2,769,229,841.09 | 1.20% |
| 10 | 3901 | Ethylene Polymers | $2,584,453,577.16 | 1.10% |
| 11 | 2902 | Cyclic Hydrocarbons | $2,390,540,232.98 | 1.10% |
| 12 | 3002 | Human or Animal Blood | $2,298,673,673.65 | 1.00% |
| 13 | 8541 | Semiconductor Devices | $2,275,905,969.36 | 1.00% |
| 14 | 3902 | Propylene Polymers | $2,228,406,845.17 | 0.99% |
| 15 | 8523 | Blank Audio Media | $2,199,984,875.09 | 0.97% |
| 16 | 8443 | Industrial Printers | $2,117,679,041.84 | 0.94% |
| 17 | 8525 | Broadcasting Equipment | $2,037,380,512.40 | 0.90% |
| 18 | 9027 | Chemical Analysis Instruments | $1,871,969,625.34 | 0.83% |
| 19 | 8411 | Gas Turbines | $1,833,296,235.79 | 0.81% |
| 20 | 8905 | Special Purpose Ships | $1,789,265,196.91 | 0.79% |
What are the top markets for Singapore ?
| Sr | Code | Country Name | Value of Exports | Percent of total |
| 1 | CHN | China | $30,771,606,420.43 | 14% |
| 2 | MYS | Malaysia | $26,329,801,343.57 | 12% |
| 3 | IDN | Indonesia | $26,123,030,493.79 | 12% |
| 4 | HKG | Hong Kong | $16,825,786,886.97 | 7.40% |
| 5 | AUS | Australia | $13,531,485,404.07 | 6.00% |
| 6 | KOR | South Korea | $10,033,195,694.07 | 4.40% |
| 7 | USA | United States | $8,471,753,347.94 | 3.80% |
| 8 | IND | India | $7,790,473,156.55 | 3.40% |
| 9 | JPN | Japan | $6,933,514,515.10 | 3.10% |
| 10 | THA | Thailand | $6,559,702,554.45 | 2.90% |
| 11 | DEU | Germany | $6,423,041,730.30 | 2.80% |
| 12 | VNM | Vietnam | $5,905,263,119.08 | 2.60% |
| 13 | BLX | Belgium-Luxembourg | $5,300,464,926.50 | 2.30% |
| 14 | NLD | Netherlands | $4,681,202,929.60 | 2.10% |
| 15 | GBR | United Kingdom | $4,498,250,509.34 | 2.00% |
| 16 | PHL | Philippines | $4,157,502,696.23 | 1.80% |
| 17 | Other Asia | $3,850,986,524.00 | 1.70% | |
| 18 | FRA | France | $3,746,379,291.25 | 1.70% |
| 19 | PAN | Panama | $3,585,328,919.00 | 1.60% |
| 20 | ARE | United Arab Emirates | $2,178,990,172.00 | 0.96% |
Statistics sourced from The Observatory of Economic Complexity.
Singapore continues to strengthen its local production capabilities, and diversify its export markets.
Are you looking to source products from Singapore ? Need guidance and linkages to export sources. Click here to send your questions.


