Thailand – Exports
What is the composition of Thailand exports ?
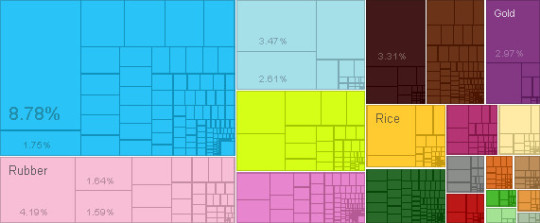
What are the top exports of Thailand ?
| Sr | HS | Description | Value of Exports | Percent of total |
| 1 | 8471 | Computers | $19,108,404,281.25 | 8.80% |
| 2 | 4001 | Rubber | $9,106,712,597.90 | 4.20% |
| 3 | 8704 | Delivery Trucks | $7,539,899,379.69 | 3.50% |
| 4 | 2710 | Refined Petroleum | $7,195,694,105.22 | 3.30% |
| 5 | 7108 | Gold | $6,451,086,147.86 | 3.00% |
| 6 | 8703 | Cars | $5,667,003,277.30 | 2.60% |
| 7 | 8708 | Vehicle Parts | $5,360,959,346.80 | 2.50% |
| 8 | 1006 | Rice | $4,556,091,039.40 | 2.10% |
| 9 | 1701 | Raw Sugar | $3,873,688,514.17 | 1.80% |
| 10 | 8473 | Office Machine Parts | $3,813,476,894.11 | 1.80% |
| 11 | 8542 | Integrated Circuits | $3,744,690,850.26 | 1.70% |
| 12 | 4011 | Rubber Tires | $3,564,278,537.86 | 1.60% |
| 13 | 3901 | Ethylene Polymers | $3,463,013,386.75 | 1.60% |
| 14 | 8415 | Air Conditioners | $3,430,930,819.61 | 1.60% |
| 15 | 1604 | Processed Fish | $3,366,577,074.18 | 1.50% |
| 16 | 8521 | Video Recording Equipment | $3,265,663,139.93 | 1.50% |
| 17 | 7113 | Jewellery | $2,754,106,411.89 | 1.30% |
| 18 | 8517 | Telephones | $2,707,955,214.39 | 1.20% |
| 19 | 1602 | Other Prepared Meat | $2,259,257,350.80 | 1.00% |
| 20 | 3907 | Polyacetals | $2,026,649,089.30 | 0.93% |
What are the top markets for Thailand ?
| Sr | Code | Country Name | Value of Exports | Percent of total |
| 1 | CHN | China | $30,841,024,815.53 | 14% |
| 2 | JPN | Japan | $22,542,214,436.45 | 10% |
| 3 | USA | United States | $21,199,857,122.38 | 9.70% |
| 4 | IDN | Indonesia | $11,361,183,595.85 | 5.20% |
| 5 | MYS | Malaysia | $10,962,593,054.39 | 5.00% |
| 6 | AUS | Australia | $10,460,971,118.26 | 4.80% |
| 7 | HKG | Hong Kong | $9,724,283,034.26 | 4.50% |
| 8 | SGP | Singapore | $8,625,569,718.03 | 4.00% |
| 9 | IND | India | $5,728,641,708.56 | 2.60% |
| 10 | VNM | Vietnam | $5,377,157,643.71 | 2.50% |
| 11 | KOR | South Korea | $5,317,593,365.46 | 2.40% |
| 12 | CHE | Switzerland | $5,196,345,039.79 | 2.40% |
| 13 | DEU | Germany | $5,138,048,653.59 | 2.40% |
| 14 | PHL | Philippines | $4,149,472,742.16 | 1.90% |
| 15 | GBR | United Kingdom | $3,851,492,294.47 | 1.80% |
| 16 | MEX | Mexico | $3,198,537,136.04 | 1.50% |
| 17 | NLD | Netherlands | $3,057,379,659.22 | 1.40% |
| 18 | Other Asia | $2,584,655,749.00 | 1.20% | |
| 19 | FRA | France | $2,529,301,075.28 | 1.20% |
| 20 | BRA | Brazil | $2,508,684,970.16 | 1.20% |
Statistics sourced from The Observatory of Economic Complexity.
Thailand continues to strengthen its local production capabilities, and diversify its export markets.
Are you looking to source products from Thailand ? Need guidance and linkages to export sources. Click here to send your questions.
![]()