Vietnam – Exports
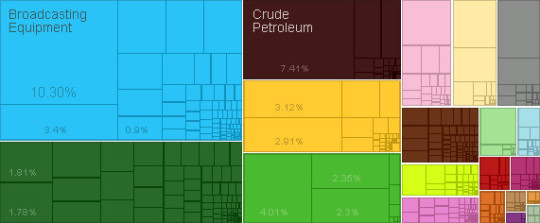
What is the composition of Vietnam exports ?
What are the top exports of Vietnam ?
| Sr | HS | Description | Value of Exports | Percent of total |
| 1 | 8525 | Broadcasting Equipment | $11,520,619,168.35 | 10% |
| 2 | 2709 | Crude Petroleum | $8,292,567,644.70 | 7.40% |
| 3 | 6403 | Leather Footwear | $4,483,537,608.02 | 4.00% |
| 4 | 8471 | Computers | $3,806,176,230.79 | 3.40% |
| 5 | 901 | Coffee | $3,492,727,758.51 | 3.10% |
| 6 | 1006 | Rice | $3,254,242,763.06 | 2.90% |
| 7 | 6402 | Rubber Footwear | $2,623,893,854.03 | 2.30% |
| 8 | 6404 | Textile Footwear | $2,572,869,402.65 | 2.30% |
| 9 | 8542 | Integrated Circuits | $2,443,181,633.48 | 2.20% |
| 10 | 9403 | Other Furniture | $2,426,293,913.71 | 2.20% |
| 11 | 4001 | Rubber | $2,135,193,915.17 | 1.90% |
| 12 | 6204 | Non-Knit Women’s Suits | $2,029,753,889.68 | 1.80% |
| 13 | 304 | Fish Fillets | $2,014,458,254.82 | 1.80% |
| 14 | 6110 | Knit Sweaters | $1,988,768,557.47 | 1.80% |
| 15 | 8529 | Broadcasting Accessories | $1,899,508,246.81 | 1.70% |
| 16 | 8544 | Insulated Wire | $1,813,534,708.79 | 1.60% |
| 17 | 6203 | Non-Knit Men’s Suits | $1,635,791,604.61 | 1.50% |
| 18 | 2701 | Coal Briquettes | $1,501,346,799.99 | 1.30% |
| 19 | 8517 | Telephones | $1,498,845,436.19 | 1.30% |
| 20 | 306 | Crustaceans | $1,428,032,903.12 | 1.30% |
What are the top markets for Vietnam ?
| Sr | Code | Country Name | Value of Exports | Percent of total |
| 1 | USA | United States | $17,704,358,753.41 | 16% |
| 2 | JPN | Japan | $14,045,993,064.14 | 13% |
| 3 | CHN | China | $13,738,699,326.53 | 12% |
| 4 | DEU | Germany | $6,359,226,991.79 | 5.70% |
| 5 | KOR | South Korea | $5,620,760,876.97 | 5.00% |
| 6 | HKG | Hong Kong | $4,164,394,596.37 | 3.70% |
| 7 | MYS | Malaysia | $3,996,363,544.69 | 3.60% |
| 8 | GBR | United Kingdom | $3,827,765,523.87 | 3.40% |
| 9 | FRA | France | $3,321,614,392.45 | 3.00% |
| 10 | AUS | Australia | $3,161,513,503.94 | 2.80% |
| 11 | IDN | Indonesia | $2,631,125,510.68 | 2.40% |
| 12 | ITA | Italy | $2,247,705,258.94 | 2.00% |
| 13 | ESP | Spain | $2,217,160,027.24 | 2.00% |
| 14 | RUS | Russia | $2,189,421,512.13 | 2.00% |
| 15 | THA | Thailand | $2,077,716,342.68 | 1.90% |
| 16 | NLD | Netherlands | $2,009,897,189.15 | 1.80% |
| 17 | IND | India | $1,880,263,064.76 | 1.70% |
| 18 | KHM | Cambodia | $1,853,905,638.08 | 1.70% |
| 19 | SGP | Singapore | $1,478,161,152.44 | 1.30% |
| 20 | BLX | Belgium-Luxembourg | $1,255,810,980.92 | 1.10% |
Statistics sourced from The Observatory of Economic Complexity.
Vietnam continues to strengthen its local production capabilities, and diversify its export markets.
Are you looking to source products from Vietnam ? Need guidance and linkages to export sources. Click here to send your questions.


