Bulgaria – Imports
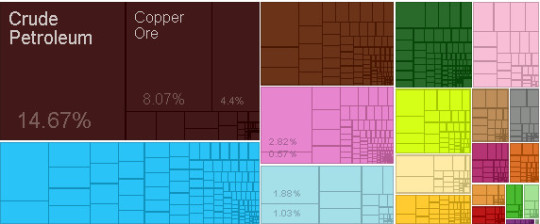
What is the composition of Bulgaria’s imports?
What are the top imports of Bulgaria ?
| Sr | HS | Description | Value of Exports | Percent of total |
| 1 | 2710 | Refined Petroleum | $3,602,255,948.49 | 13% |
| 2 | 7403 | Refined Copper | $1,927,722,981.48 | 7.20% |
| 3 | 3004 | Packaged Medicaments | $773,461,867.47 | 2.90% |
| 4 | 1001 | Wheat | $725,218,150.16 | 2.70% |
| 5 | 7402 | Raw Copper | $665,734,774.65 | 2.50% |
| 6 | 1206 | Sunflower Seeds | $464,568,028.17 | 1.70% |
| 7 | 6203 | Non-Knit Men’s Suits | $375,064,757.99 | 1.40% |
| 8 | 6204 | Non-Knit Women’s Suits | $372,953,121.27 | 1.40% |
| 9 | 2603 | Copper Ore | $369,868,907.60 | 1.40% |
| 10 | 8544 | Insulated Wire | $350,265,745.61 | 1.30% |
| 11 | 2616 | Precious Metal Ore | $342,770,636.44 | 1.30% |
| 12 | 7204 | Scrap Iron | $325,756,624.19 | 1.20% |
| 13 | 7112 | Precious Metal Scraps | $306,105,891.10 | 1.10% |
| 14 | 2402 | Rolled Tobacco | $269,498,481.68 | 1.00% |
| 15 | 1005 | Corn | $230,498,222.95 | 0.86% |
| 16 | 7409 | Copper Plating | $215,508,206.98 | 0.80% |
| 17 | 2836 | Carbonates | $211,076,237.90 | 0.79% |
| 18 | 8418 | Refrigerators | $208,159,639.20 | 0.78% |
| 19 | 7214 | Raw Iron Bars | $201,658,183.05 | 0.75% |
| 20 | 3002 | Human or Animal Blood | $198,783,289.95 | 0.74% |
Who are the top countries of origin for Bulgaria ?
| Sr | Code | Country Name | Value of Exports | Percent of total |
| 1 | ITA | Italy | $2,684,416,676.49 | 10% |
| 2 | DEU | Germany | $2,629,608,787.75 | 9.80% |
| 3 | TUR | Turkey | $2,619,562,518.05 | 9.80% |
| 4 | ROU | Romania | $1,905,225,111.11 | 7.10% |
| 5 | GRC | Greece | $1,637,218,522.98 | 6.10% |
| 6 | FRA | France | $1,121,351,866.59 | 4.20% |
| 7 | BLX | Belgium-Luxembourg | $1,087,854,537.93 | 4.10% |
| 8 | GIB | Gibraltar | $940,035,343.00 | 3.50% |
| 9 | CHN | China | $822,619,305.84 | 3.10% |
| 10 | RUS | Russia | $746,056,053.91 | 2.80% |
| 11 | ESP | Spain | $677,097,512.50 | 2.50% |
| 12 | USA | United States | $529,684,223.68 | 2.00% |
| 13 | SRB | Serbia | $522,007,870.19 | 1.90% |
| 14 | AUT | Austria | $518,375,262.30 | 1.90% |
| 15 | NLD | Netherlands | $494,497,431.39 | 1.80% |
| 16 | GBR | United Kingdom | $482,324,470.56 | 1.80% |
| 17 | POL | Poland | $428,223,777.25 | 1.60% |
| 18 | MKD | Macedonia | $369,398,031.09 | 1.40% |
| 19 | ZAF | South Africa | $308,918,895.28 | 1.20% |
| 20 | UKR | Ukraine | $305,269,081.52 | 1.10% |
Statistics sourced from The Observatory of Economic Complexity.
Bulgaria continues to strengthen its local production capabilities, and diversify its export markets.
Are you looking to source products from Bulgaria ? Need guidance and linkages to export sources. Click here to send your questions.


