Qatar – Imports
What is the composition of Qatar’s imports?
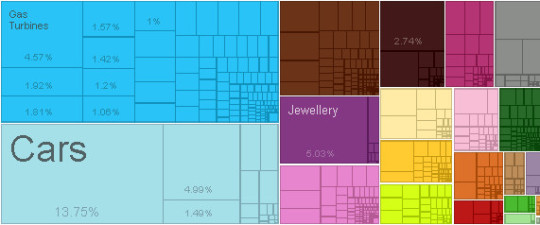
What are the top imports of Qatar ?
| Sr | HS | Description | Value of Exports | Percent of total |
| 1 | 8703 | Cars | $2,223,995,220.00 | 14% |
| 2 | 7113 | Jewellery | $813,854,668.00 | 5.00% |
| 3 | 8802 | Planes, Helicopters, and/or Spacecraft | $807,364,626.00 | 5.00% |
| 4 | 8411 | Gas Turbines | $739,046,725.00 | 4.60% |
| 5 | 2601 | Iron Ore | $442,690,979.00 | 2.70% |
| 6 | 8481 | Valves | $310,808,446.00 | 1.90% |
| 7 | 8544 | Insulated Wire | $292,928,603.00 | 1.80% |
| 8 | 8414 | Air Pumps | $253,224,884.00 | 1.60% |
| 9 | 9403 | Other Furniture | $246,711,578.00 | 1.50% |
| 10 | 8704 | Delivery Trucks | $241,308,478.00 | 1.50% |
| 11 | 8419 | Other Heating Machinery | $229,901,177.00 | 1.40% |
| 12 | 8537 | Electrical Control Boards | $194,204,801.00 | 1.20% |
| 13 | 2710 | Refined Petroleum | $189,894,201.00 | 1.20% |
| 14 | 8413 | Liquid Pumps | $172,098,278.00 | 1.10% |
| 15 | 7308 | Iron Structures | $165,719,526.00 | 1.00% |
| 16 | 8504 | Electrical Transformers | $162,389,005.00 | 1.00% |
| 17 | 7304 | Iron Pipes | $151,932,789.00 | 0.94% |
| 18 | 1006 | Rice | $148,465,362.00 | 0.92% |
| 19 | 3004 | Packaged Medicaments | $144,808,995.00 | 0.90% |
| 20 | 207 | Poultry Meat | $142,963,651.00 | 0.88% |
Who are the top countries of origin for Qatar ?
| Sr | Code | Country Name | Value of Imports | Percent of total |
| 1 | GBR | United Kingdom | $2,017,924,268.00 | 12% |
| 2 | USA | United States | $1,696,135,746.00 | 10% |
| 3 | JPN | Japan | $1,496,959,264.00 | 9.30% |
| 4 | DEU | Germany | $1,443,268,387.00 | 8.90% |
| 5 | ITA | Italy | $1,309,395,770.00 | 8.10% |
| 6 | CHN | China | $1,200,172,607.00 | 7.40% |
| 7 | KOR | South Korea | $729,798,987.00 | 4.50% |
| 8 | IND | India | $693,422,573.00 | 4.30% |
| 9 | CHE | Switzerland | $626,792,627.00 | 3.90% |
| 10 | FRA | France | $604,191,028.00 | 3.70% |
| 11 | NLD | Netherlands | $451,774,703.00 | 2.80% |
| 12 | SWE | Sweden | $344,535,820.00 | 2.10% |
| 13 | BRA | Brazil | $316,672,829.00 | 2.00% |
| 14 | AUS | Australia | $277,664,560.00 | 1.70% |
| 15 | TUR | Turkey | $252,452,924.00 | 1.60% |
| 16 | ESP | Spain | $240,030,893.00 | 1.50% |
| 17 | BLX | Belgium-Luxembourg | $215,988,587.00 | 1.30% |
| 18 | EGY | Egypt | $212,450,671.00 | 1.30% |
| 19 | MYS | Malaysia | $193,939,328.00 | 1.20% |
| 20 | OMN | Oman | $188,538,242.00 | 1.20% |
Statistics sourced from The Observatory of Economic Complexity.
Qatar continues to strengthen its local production capabilities, and diversify its export markets.
Are you looking to source products from Qatar ? Need guidance and linkages to export sources. Click here to send your questions.


