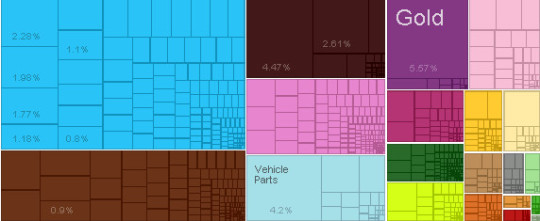
Thailand – Imports
What is the composition of Thailand’s imports?
What are the top imports of Thailand ?
| Sr | HS | Description | Value of Exports | Percent of total |
| 1 | 7108 | Gold | $10,718,391,541.04 | 5.60% |
| 2 | 2709 | Crude Petroleum | $8,590,449,213.72 | 4.50% |
| 3 | 8708 | Vehicle Parts | $8,069,524,849.70 | 4.20% |
| 4 | 2711 | Petroleum Gas | $5,027,488,533.39 | 2.60% |
| 5 | 8471 | Computers | $4,386,513,006.90 | 2.30% |
| 6 | 8473 | Office Machine Parts | $3,811,898,798.61 | 2.00% |
| 7 | 8542 | Integrated Circuits | $3,407,606,181.66 | 1.80% |
| 8 | 7210 | Coated Flat-Rolled Iron | $2,492,036,472.32 | 1.30% |
| 9 | 8802 | Planes, Helicopters, and/or Spacecraft | $2,277,926,641.62 | 1.20% |
| 10 | 8409 | Engine Parts | $2,268,612,085.70 | 1.20% |
| 11 | 8529 | Broadcasting Accessories | $2,246,321,983.88 | 1.20% |
| 12 | 303 | Non-fillet Frozen Fish | $2,206,314,109.14 | 1.10% |
| 13 | 8525 | Broadcasting Equipment | $2,120,215,180.45 | 1.10% |
| 14 | 7403 | Refined Copper | $2,041,113,981.47 | 1.10% |
| 15 | 7208 | Hot-Rolled Iron | $2,024,384,758.64 | 1.10% |
| 16 | 7326 | Other Iron Products | $2,013,259,839.32 | 1.00% |
| 17 | 8536 | Low-voltage Protection Equipment | $1,799,851,952.03 | 0.94% |
| 18 | 7207 | Semi-Finished Iron | $1,723,729,933.06 | 0.90% |
| 19 | 8479 | Machinery Having Individual Functions | $1,594,452,152.41 | 0.83% |
| 20 | 8523 | Blank Audio Media | $1,557,352,548.76 | 0.81% |
Who are the top countries of origin for Thailand ?
| Sr | Code | Country Name | Value of Imports | Percent of total |
| 1 | JPN | Japan | $43,071,041,462.34 | 22% |
| 2 | CHN | China | $34,583,714,207.33 | 18% |
| 3 | MYS | Malaysia | $12,198,097,330.54 | 6.30% |
| 4 | USA | United States | $10,161,423,300.26 | 5.30% |
| 5 | KOR | South Korea | $8,667,281,741.89 | 4.50% |
| 6 | IDN | Indonesia | $7,635,526,590.01 | 4.00% |
| 7 | CHE | Switzerland | $7,279,797,864.44 | 3.80% |
| 8 | SGP | Singapore | $6,559,702,554.45 | 3.40% |
| 9 | DEU | Germany | $5,442,130,325.07 | 2.80% |
| 10 | AUS | Australia | $5,216,648,558.71 | 2.70% |
| 11 | Other Asia | $5,142,443,761.34 | 2.70% | |
| 12 | MMR | Burma | $3,250,895,482.10 | 1.70% |
| 13 | FRA | France | $2,957,254,159.34 | 1.50% |
| 14 | PHL | Philippines | $2,884,384,414.20 | 1.50% |
| 15 | IND | India | $2,739,743,320.26 | 1.40% |
| 16 | GBR | United Kingdom | $2,650,889,837.72 | 1.40% |
| 17 | RUS | Russia | $2,341,956,054.27 | 1.20% |
| 18 | ITA | Italy | $2,175,861,867.10 | 1.10% |
| 19 | BRA | Brazil | $2,167,767,695.49 | 1.10% |
| 20 | VNM | Vietnam | $2,077,716,342.68 | 1.10% |
Statistics sourced from The Observatory of Economic Complexity.
Thailand continues to strengthen its local production capabilities, and diversify its export markets.
Are you looking to source products from Thailand ? Need guidance and linkages to export sources. Click here to send your questions.


