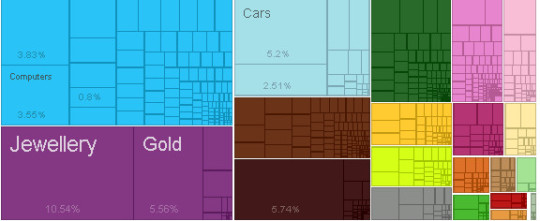
UAE – Imports
What is the composition of UAE’s imports?
What are the top imports of UAE ?
| Sr | HS | Description | Value of Exports | Percent of total |
| 1 | 7113 | Jewellery | $18,301,742,355.00 | 11% |
| 2 | 2710 | Refined Petroleum | $9,955,889,949.00 | 5.70% |
| 3 | 7108 | Gold | $9,660,639,219.00 | 5.60% |
| 4 | 8703 | Cars | $9,025,677,346.00 | 5.20% |
| 5 | 8525 | Broadcasting Equipment | $6,642,050,159.00 | 3.80% |
| 6 | 8471 | Computers | $6,169,543,978.00 | 3.60% |
| 7 | 8802 | Planes, Helicopters, and/or Spacecraft | $4,363,928,460.00 | 2.50% |
| 8 | 8411 | Gas Turbines | $2,697,048,176.00 | 1.60% |
| 9 | 7102 | Diamonds | $1,926,711,523.00 | 1.10% |
| 10 | 4011 | Rubber Tires | $1,818,104,564.00 | 1.00% |
| 11 | 8528 | Video Displays | $1,751,341,855.00 | 1.00% |
| 12 | 8708 | Vehicle Parts | $1,709,751,224.00 | 0.98% |
| 13 | 8481 | Valves | $1,698,933,589.00 | 0.98% |
| 14 | 8704 | Delivery Trucks | $1,494,556,391.00 | 0.86% |
| 15 | 5407 | Synthetic Filament Yarn Woven Fabric | $1,451,911,675.00 | 0.84% |
| 16 | 8544 | Insulated Wire | $1,394,708,521.00 | 0.80% |
| 17 | 9403 | Other Furniture | $1,366,987,271.00 | 0.79% |
| 18 | 3004 | Packaged Medicaments | $1,312,063,037.00 | 0.76% |
| 19 | 7304 | Iron Pipes | $1,242,531,572.00 | 0.72% |
| 20 | 8517 | Telephones | $1,226,517,781.00 | 0.71% |
Who are the top countries of origin for UAE ?
| Sr | Code | Country Name | Value of Imports | Percent of total |
| 1 | IND | India | $31,911,339,483.00 | 18% |
| 2 | CHN | China | $29,120,163,724.00 | 17% |
| 3 | DEU | Germany | $12,250,854,581.00 | 7.10% |
| 4 | USA | United States | $10,669,620,457.00 | 6.10% |
| 5 | JPN | Japan | $8,728,998,950.00 | 5.00% |
| 6 | TUR | Turkey | $8,113,530,081.00 | 4.70% |
| 7 | GBR | United Kingdom | $7,896,217,255.00 | 4.50% |
| 8 | ITA | Italy | $6,982,587,969.00 | 4.00% |
| 9 | KOR | South Korea | $6,860,937,700.00 | 4.00% |
| 10 | FRA | France | $4,048,344,133.00 | 2.30% |
| 11 | MYS | Malaysia | $3,877,935,713.00 | 2.20% |
| 12 | CHE | Switzerland | $3,377,425,543.00 | 1.90% |
| 13 | HKG | Hong Kong | $3,101,414,583.00 | 1.80% |
| 14 | NLD | Netherlands | $2,986,829,256.00 | 1.70% |
| 15 | BRA | Brazil | $2,410,890,634.00 | 1.40% |
| 16 | SGP | Singapore | $2,178,990,172.00 | 1.30% |
| 17 | ESP | Spain | $1,937,577,294.00 | 1.10% |
| 18 | OMN | Oman | $1,853,314,709.00 | 1.10% |
| 19 | SDN | Sudan | $1,688,947,878.00 | 0.97% |
| 20 | BLX | Belgium-Luxembourg | $1,645,076,592.00 | 0.95% |
Statistics sourced from The Observatory of Economic Complexity.
UAE continues to strengthen its local production capabilities, and diversify its export markets.
Are you looking to source products from UAE ? Need guidance and linkages to export sources. Click here to send your questions.


