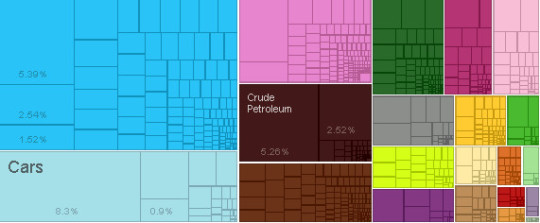
USA – Imports
What is the composition of USA’s imports?
What are the top imports of USA ?
| Sr | HS | Description | Value of Exports | Percent of total |
| 1 | 8703 | Cars | $149,316,391,823.45 | 8.30% |
| 2 | 8471 | Computers | $97,049,116,737.21 | 5.40% |
| 3 | 2709 | Crude Petroleum | $94,646,114,862.30 | 5.30% |
| 4 | 3004 | Packaged Medicaments | $46,604,033,312.00 | 2.60% |
| 5 | 8525 | Broadcasting Equipment | $45,681,535,574.20 | 2.50% |
| 6 | 2710 | Refined Petroleum | $45,409,345,906.58 | 2.50% |
| 7 | 8708 | Vehicle Parts | $34,971,372,686.77 | 1.90% |
| 8 | 8517 | Telephones | $27,280,058,363.73 | 1.50% |
| 9 | 8528 | Video Displays | $27,124,550,033.91 | 1.50% |
| 10 | 8411 | Gas Turbines | $17,735,817,837.21 | 0.99% |
| 11 | 9401 | Seats | $16,416,663,160.83 | 0.91% |
| 12 | 8704 | Delivery Trucks | $16,204,443,874.69 | 0.90% |
| 13 | 7108 | Gold | $15,706,676,057.95 | 0.87% |
| 14 | 9018 | Medical Instruments | $15,693,420,086.64 | 0.87% |
| 15 | 2933 | Nitrogen Heterocyclic Compounds | $15,181,451,806.12 | 0.84% |
| 16 | 8544 | Insulated Wire | $15,166,457,099.56 | 0.84% |
| 17 | 4011 | Rubber Tires | $13,944,855,461.29 | 0.78% |
| 18 | 8803 | Aircraft Parts | $13,924,451,582.34 | 0.77% |
| 19 | 9403 | Other Furniture | $13,542,557,758.08 | 0.75% |
| 20 | 8473 | Office Machine Parts | $13,149,913,406.59 | 0.73% |
Who are the top countries of origin for USA ?
| Sr | Code | Country Name | Value of Imports | Percent of total |
| 1 | CHN | China | $397,870,235,907.96 | 22% |
| 2 | MEX | Mexico | $244,861,600,371.62 | 14% |
| 3 | CAN | Canada | $176,854,116,170.08 | 9.80% |
| 4 | JPN | Japan | 7.80% | |
| 5 | DEU | Germany | $107,607,675,487.21 | 6.00% |
| 6 | KOR | South Korea | $62,836,441,971.20 | 3.50% |
| 7 | GBR | United Kingdom | $52,370,741,457.18 | 2.90% |
| 8 | FRA | France | $36,481,939,330.82 | 2.00% |
| 9 | ITA | Italy | $35,546,719,069.63 | 2.00% |
| 10 | IND | India | $33,811,429,974.77 | 1.90% |
| 11 | BRA | Brazil | $27,402,098,758.08 | 1.50% |
| 12 | IRL | Ireland | $27,017,706,553.85 | 1.50% |
| 13 | CHE | Switzerland | $23,324,420,889.38 | 1.30% |
| 14 | Other Asia | $22,864,919,679.12 | 1.30% | |
| 15 | COL | Colombia | $22,423,504,511.87 | 1.20% |
| 16 | THA | Thailand | $21,199,857,122.38 | 1.20% |
| 17 | NGA | Nigeria | $21,017,413,458.32 | 1.20% |
| 18 | NLD | Netherlands | $20,578,772,404.82 | 1.10% |
| 19 | IDN | Indonesia | $17,889,420,563.44 | 0.99% |
| 20 | VNM | Vietnam | $17,704,358,753.41 | 0.98% |
Statistics sourced from The Observatory of Economic Complexity.
USA continues to strengthen its local production capabilities, and diversify its export markets.
Are you looking to source products from USA ? Need guidance and linkages to export sources. Click here to send your questions.


